Where Texas Roofs Are Oldest: Housing Age by County
A CRS Roofing & Construction data study. Source: U.S. Census Bureau, American Community Survey 2020-2024 5-year estimates, tables B25034 and B25035.
Headline finding
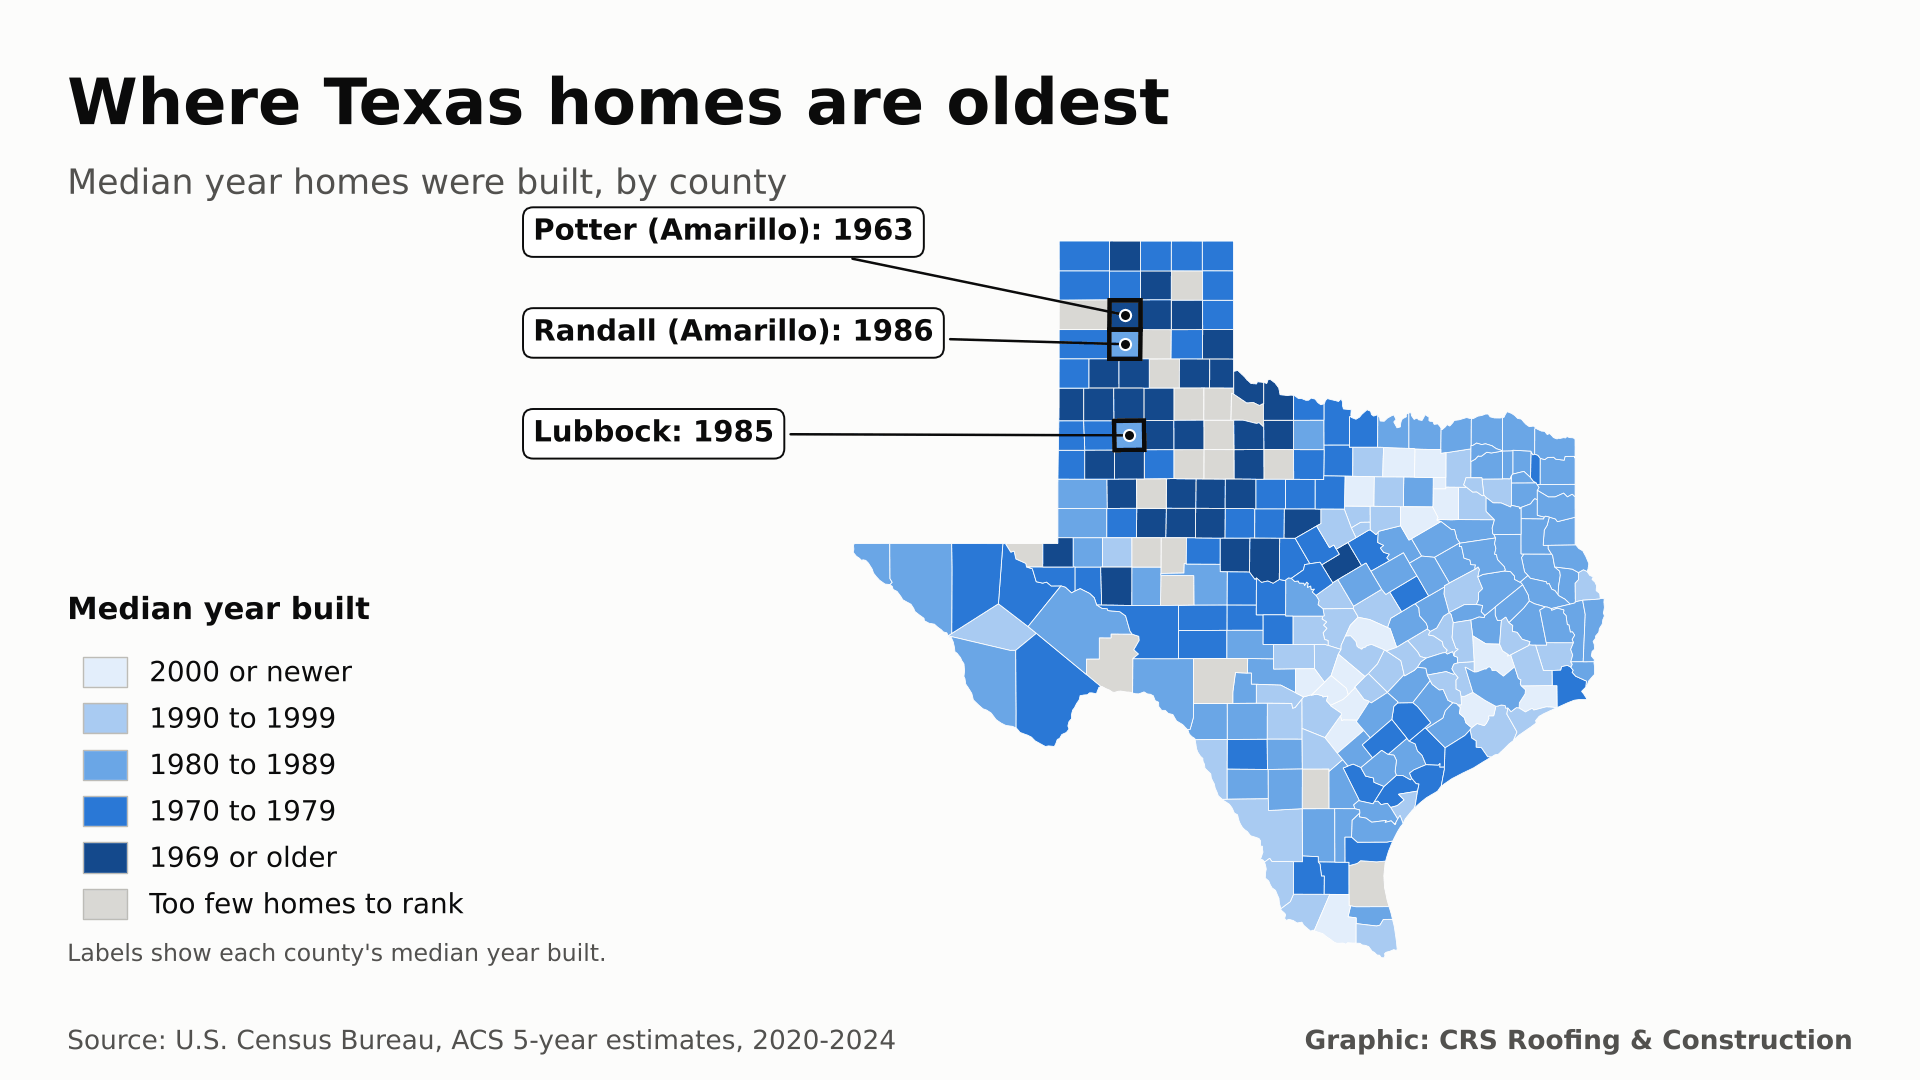
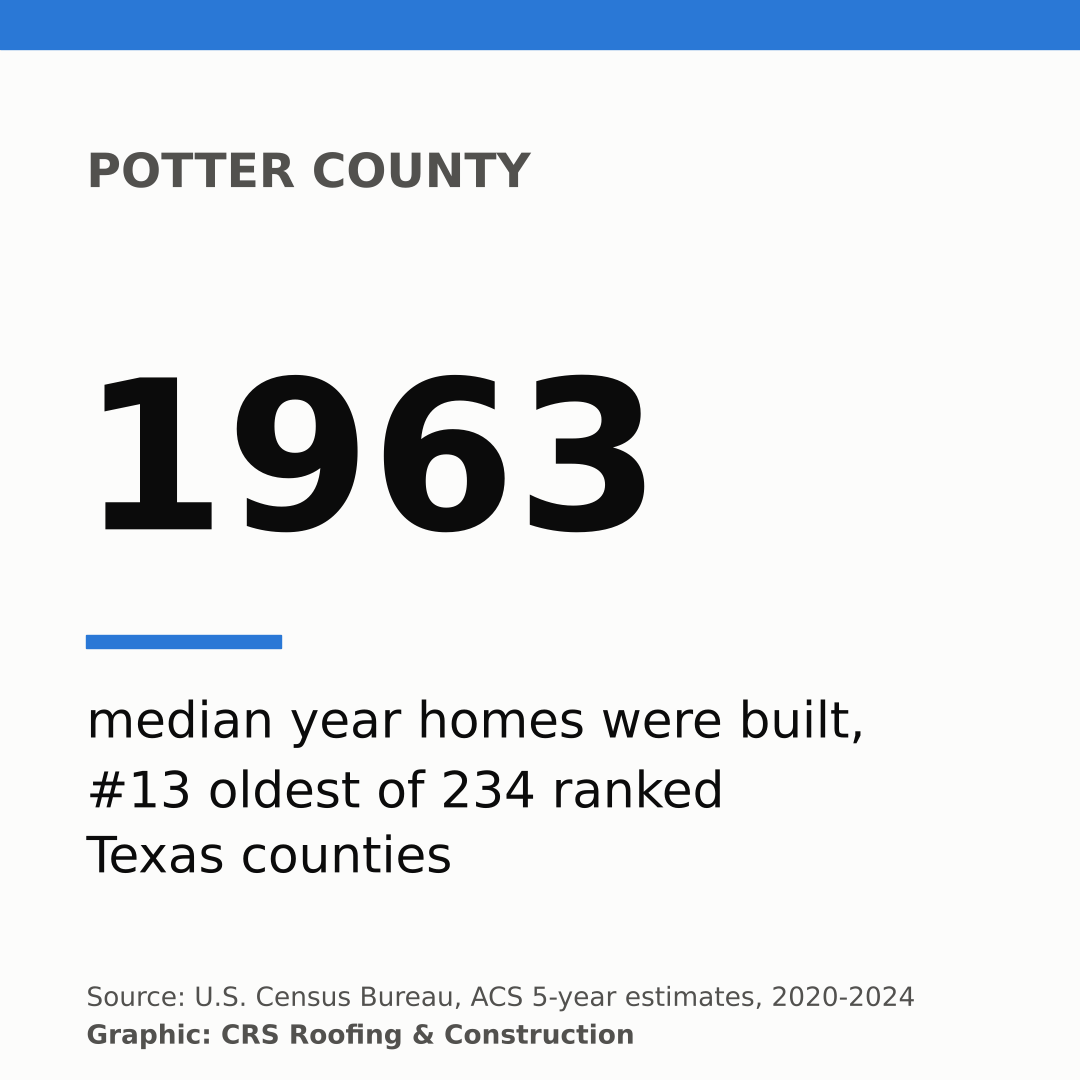
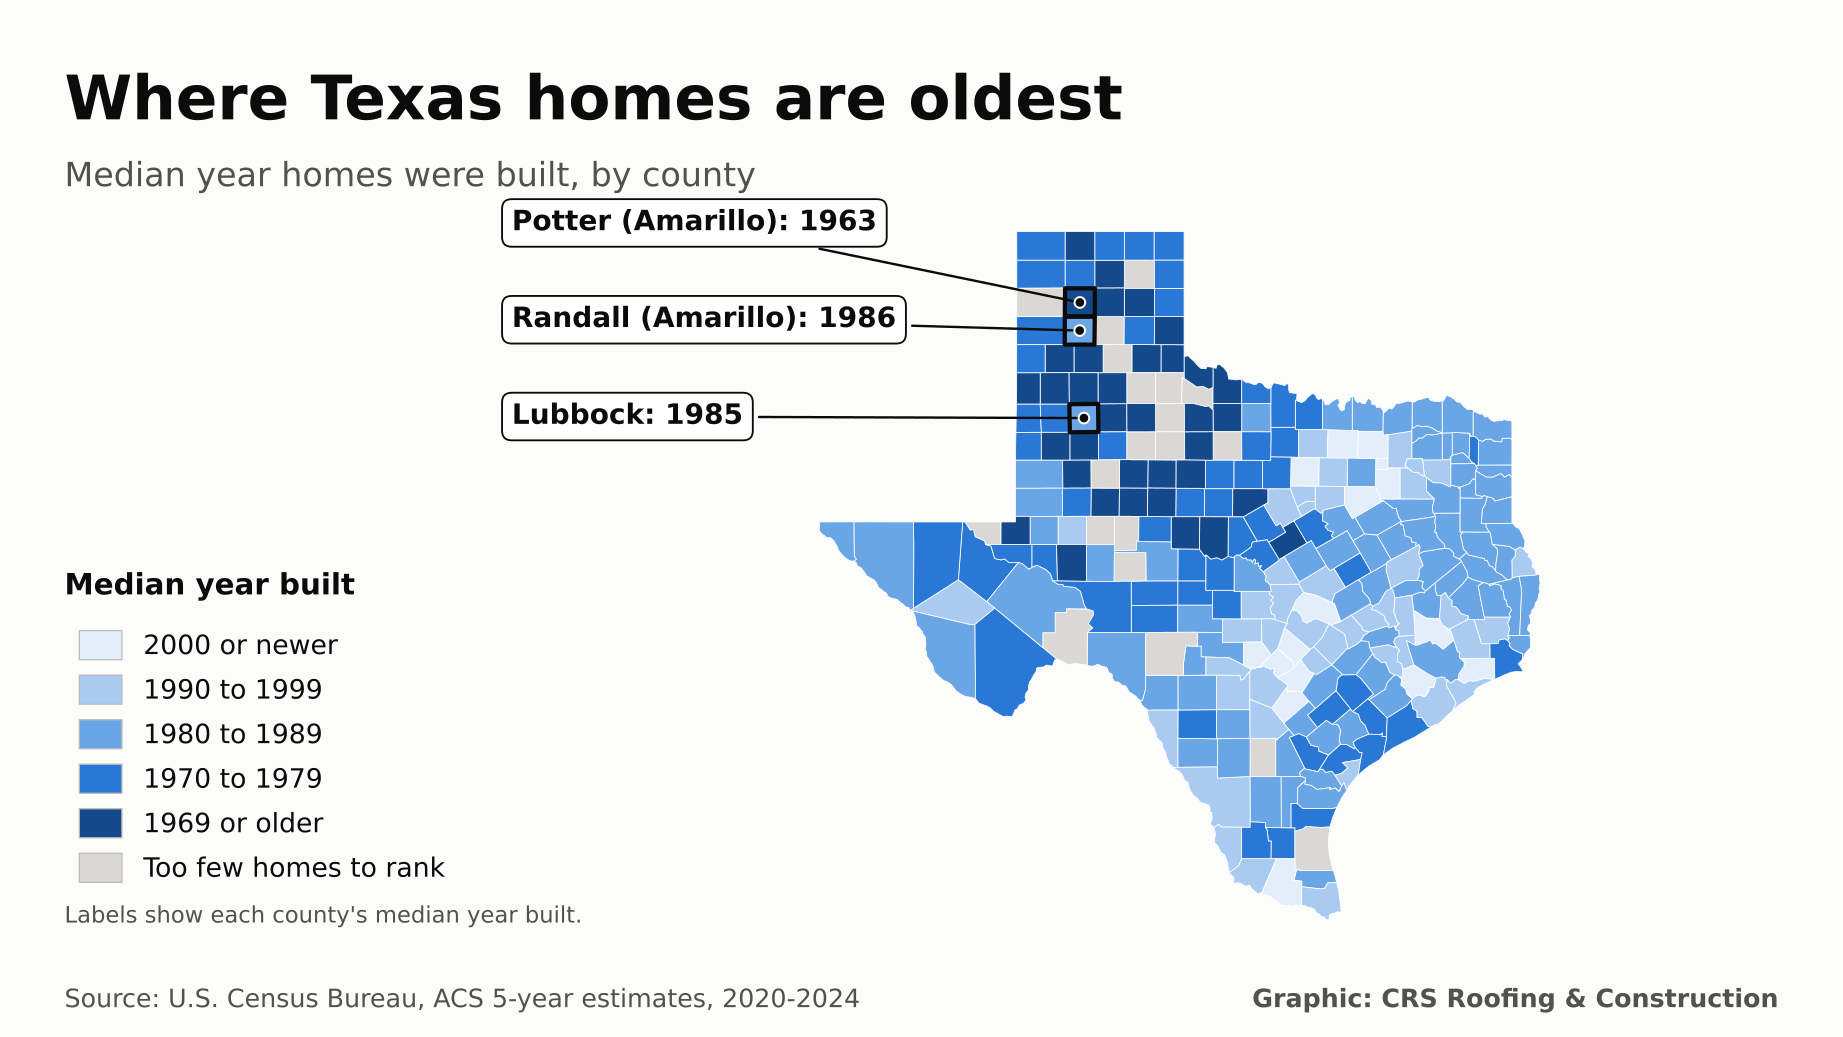
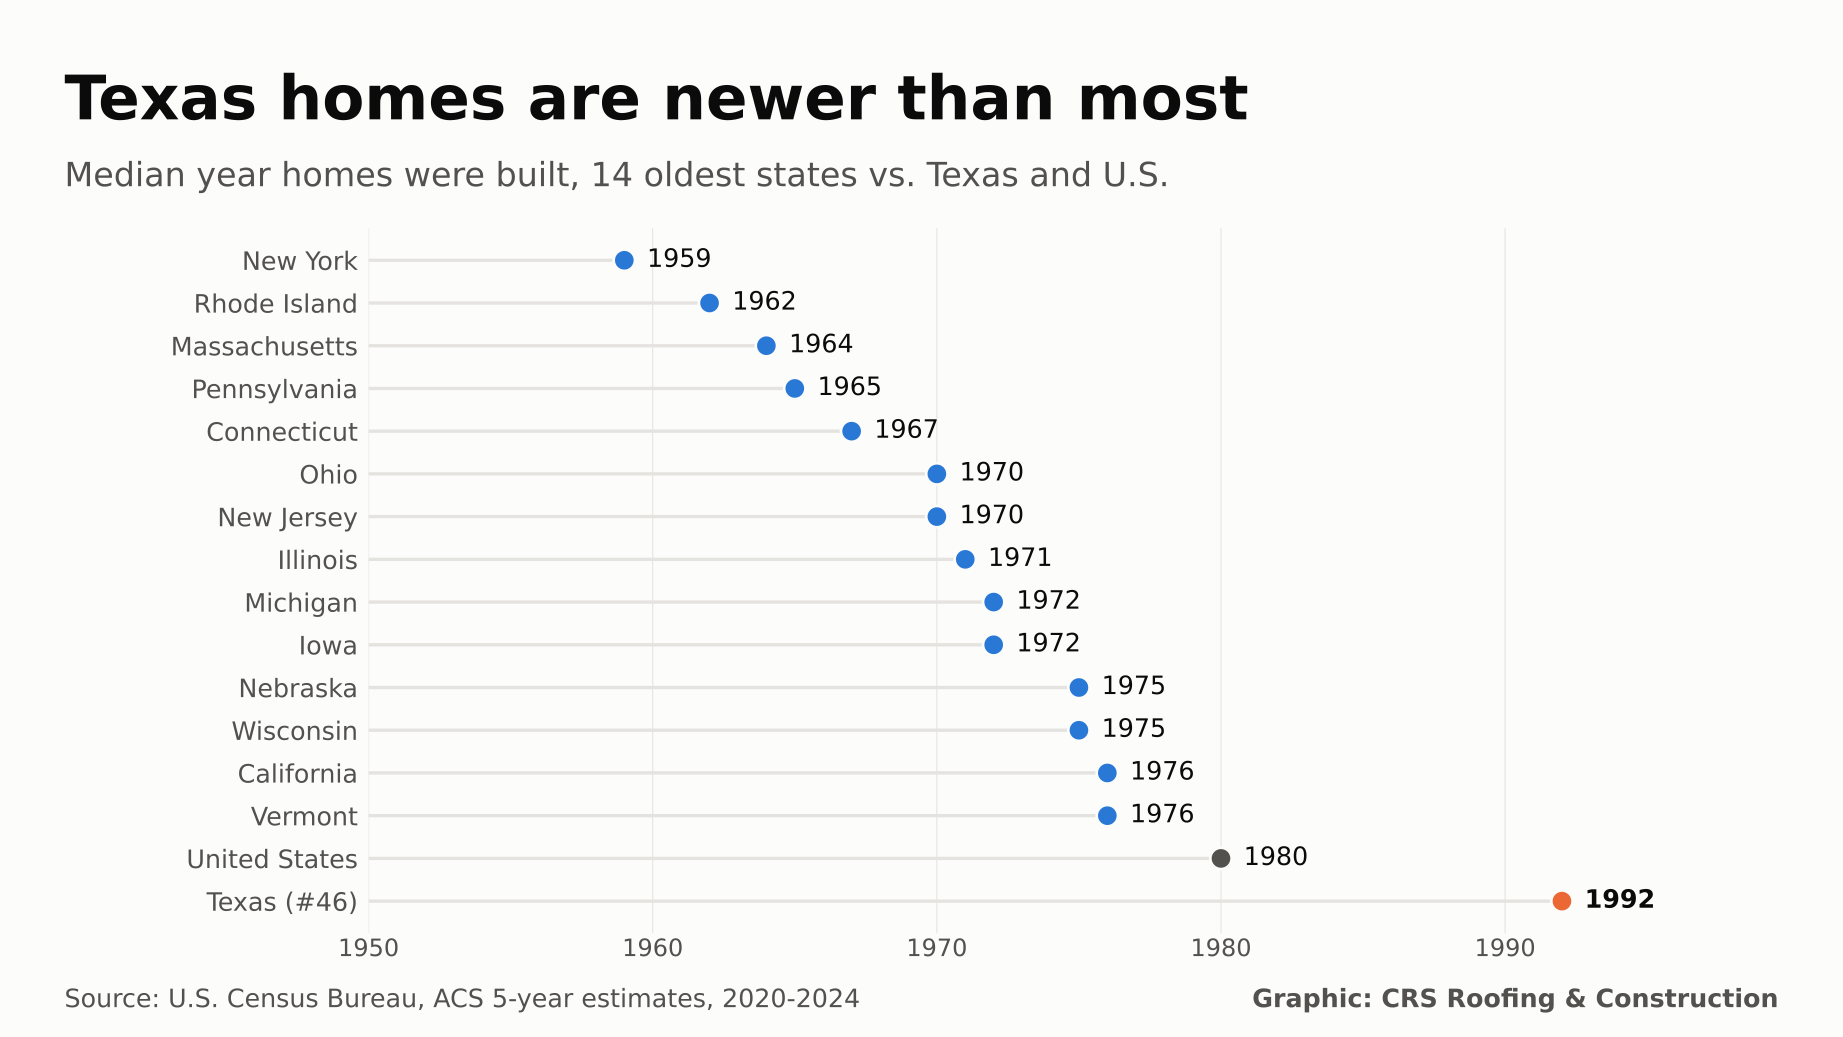
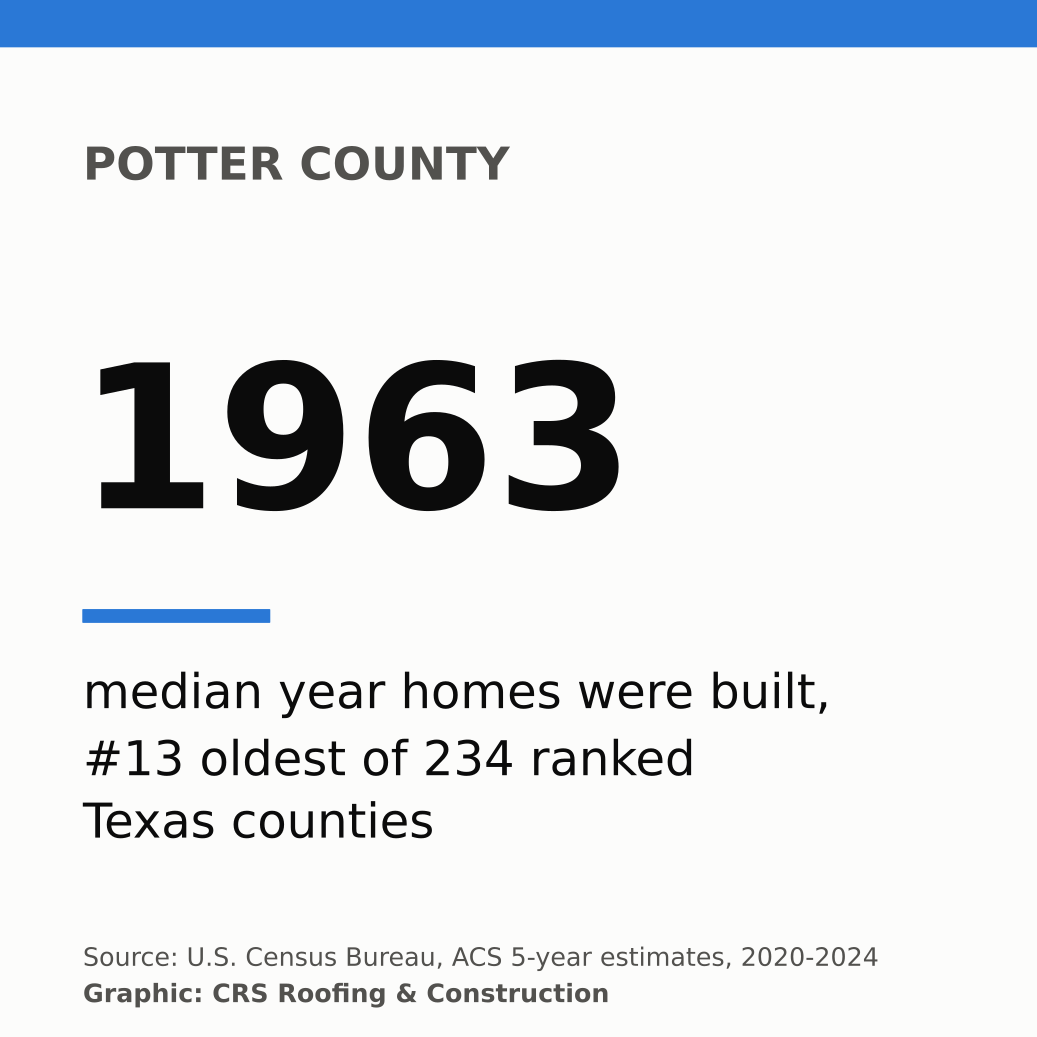
The Texas Panhandle and Rolling Plains hold the oldest housing in Texas. In Hall County, 89.2% of homes were built before 1980, the highest share in the state. Amarillo's Potter County ranks #13 of 234 counties for oldest median year built (1963), while statewide the median is 1992.
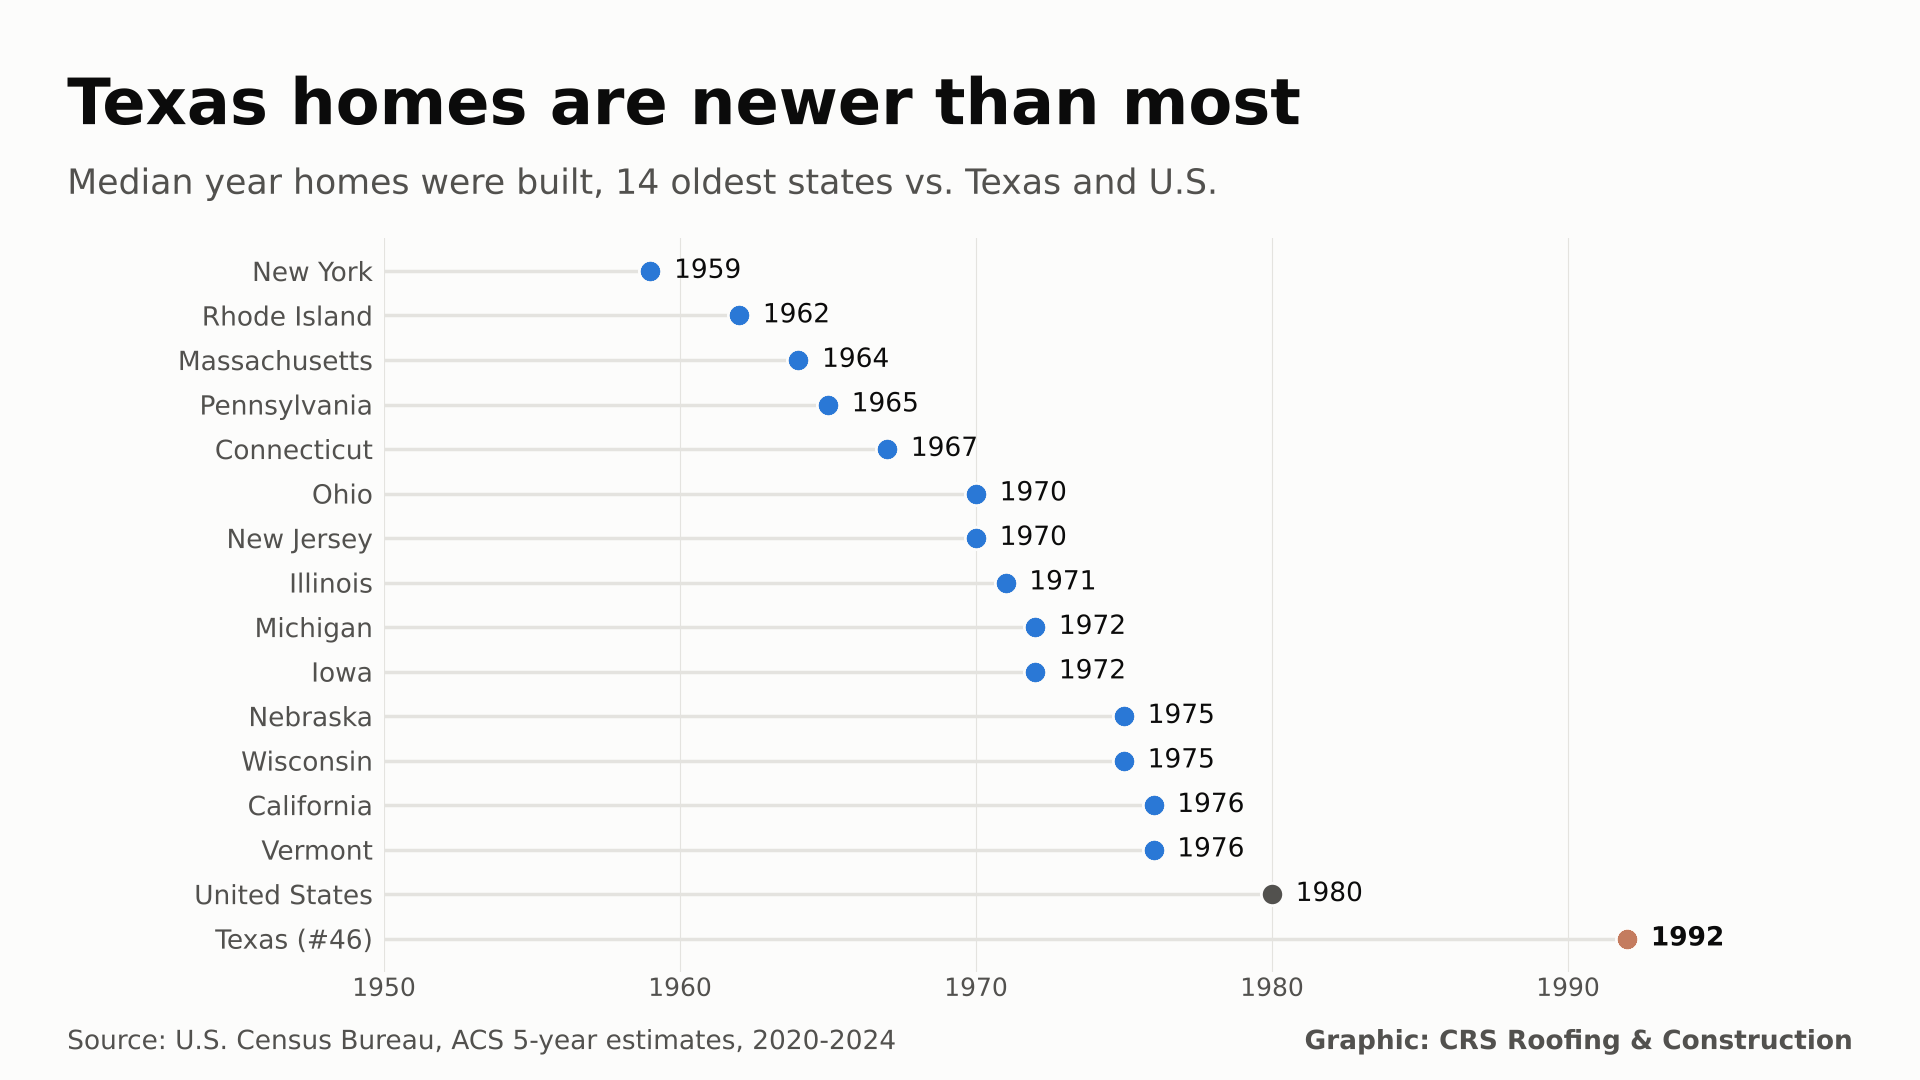
1992
Texas median year built (U.S.: 1980)
33.2%
Texas homes built before 1980 (U.S.: 49.7%)
69.6%
Potter County homes built before 1980
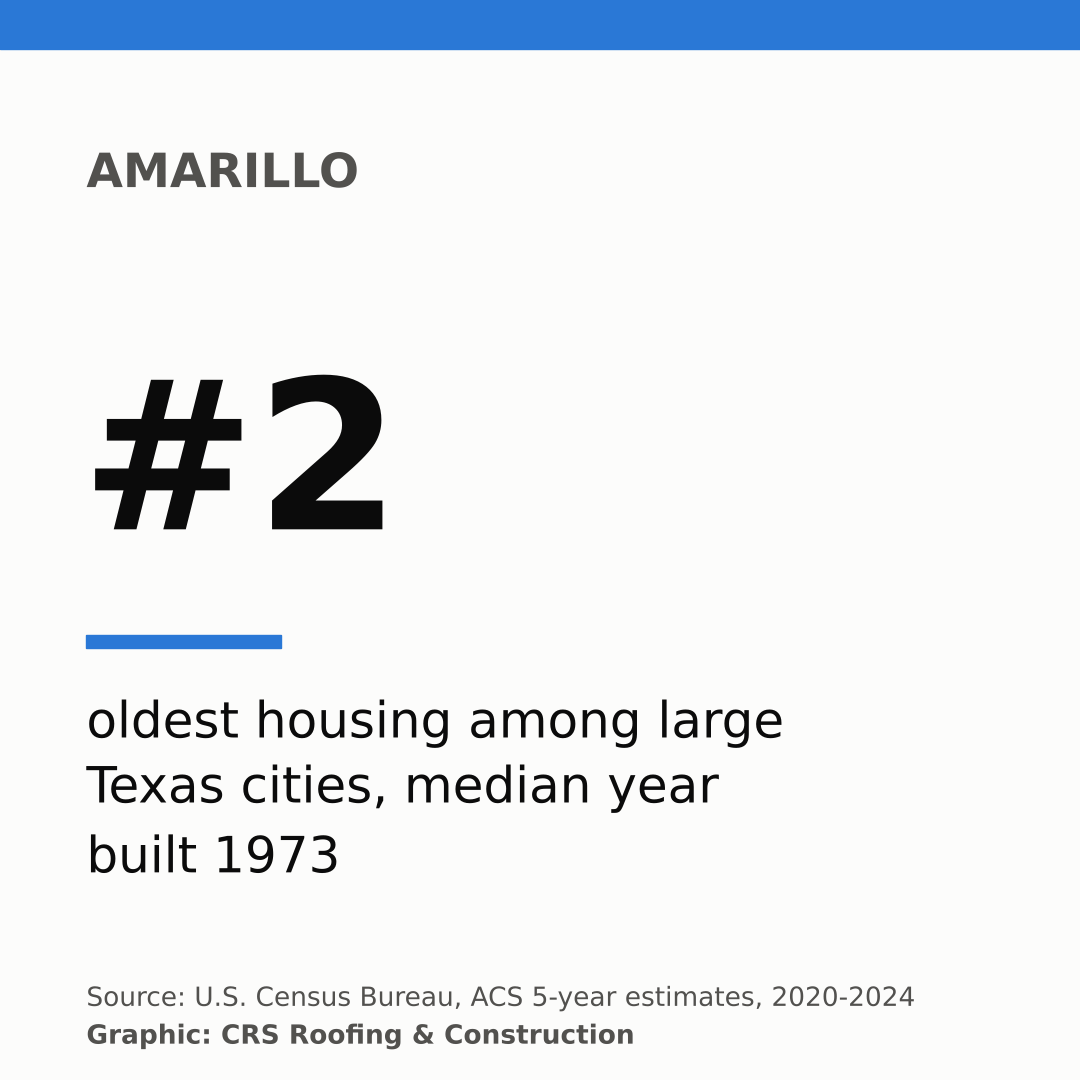
1973
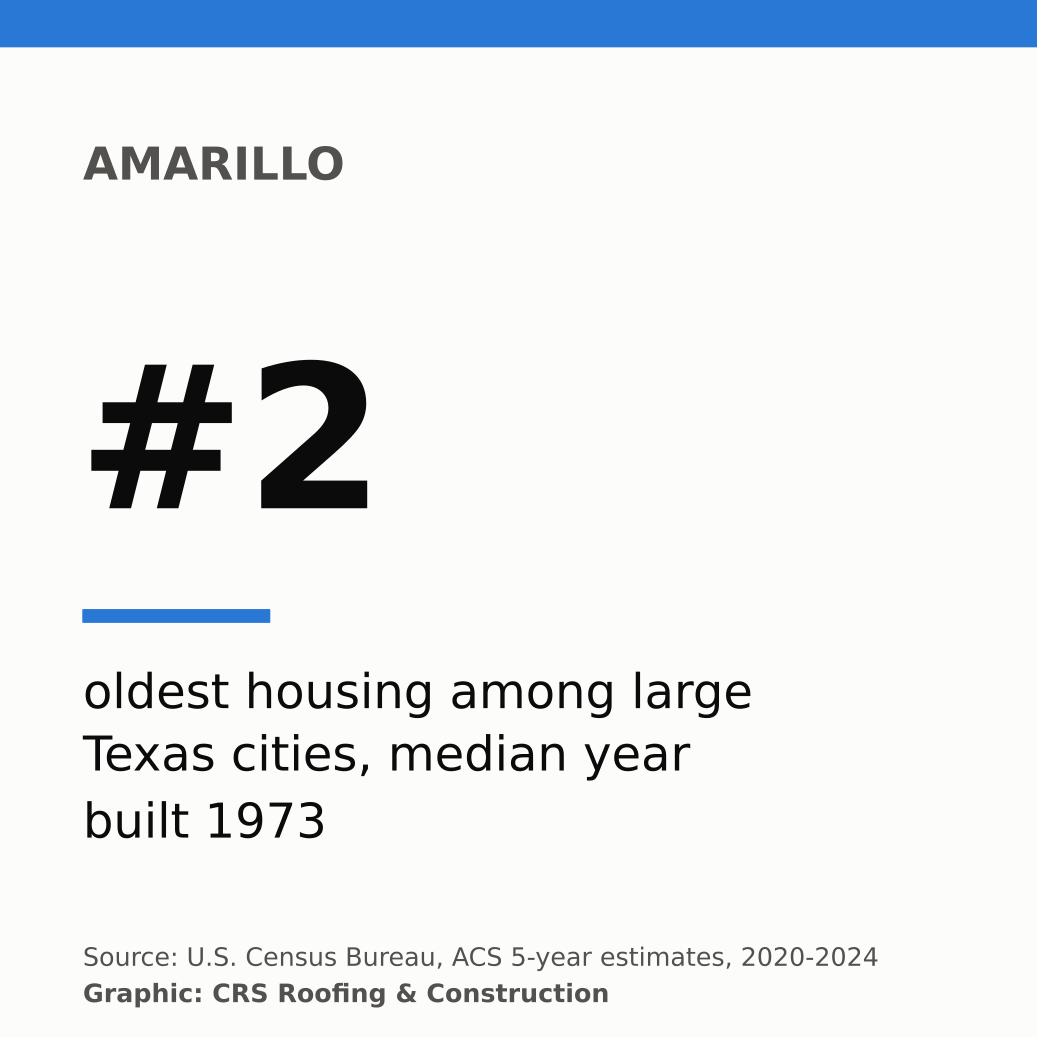
Amarillo median year built, #2 oldest of 41 large Texas cities
Key Findings
- Texas housing is young by national standards. The median Texas housing unit was built in 1992, versus 1980 nationally. Texas ranks #46 of 50 states from oldest to newest. New York has the oldest housing (1959) and Nevada the newest (1996).
- The oldest counties are rural and northwest. Runnels (1958), Hall (1959) and Carson (1959) counties have the oldest medians. Most of the top 25 sit in the Panhandle, South Plains and Rolling Plains.
- Amarillo is one of the oldest large cities in Texas. Its median year built is 1973, #2 of 41 Texas cities with 40,000 or more housing units. Only Wichita Falls (1972) is older. 60.3% of Amarillo homes were built before 1980.
- The Amarillo metro splits in two. Potter County (north Amarillo) has a median of 1963 and 69.6% pre-1980 homes. Randall County (south Amarillo and Canyon) has a median of 1986 and 42% pre-1980 homes.
- Lubbock sits near the state median. Lubbock County's median year built is 1985 (#138 of 234), with 43.8% of homes built before 1980 and 67% before 2000.
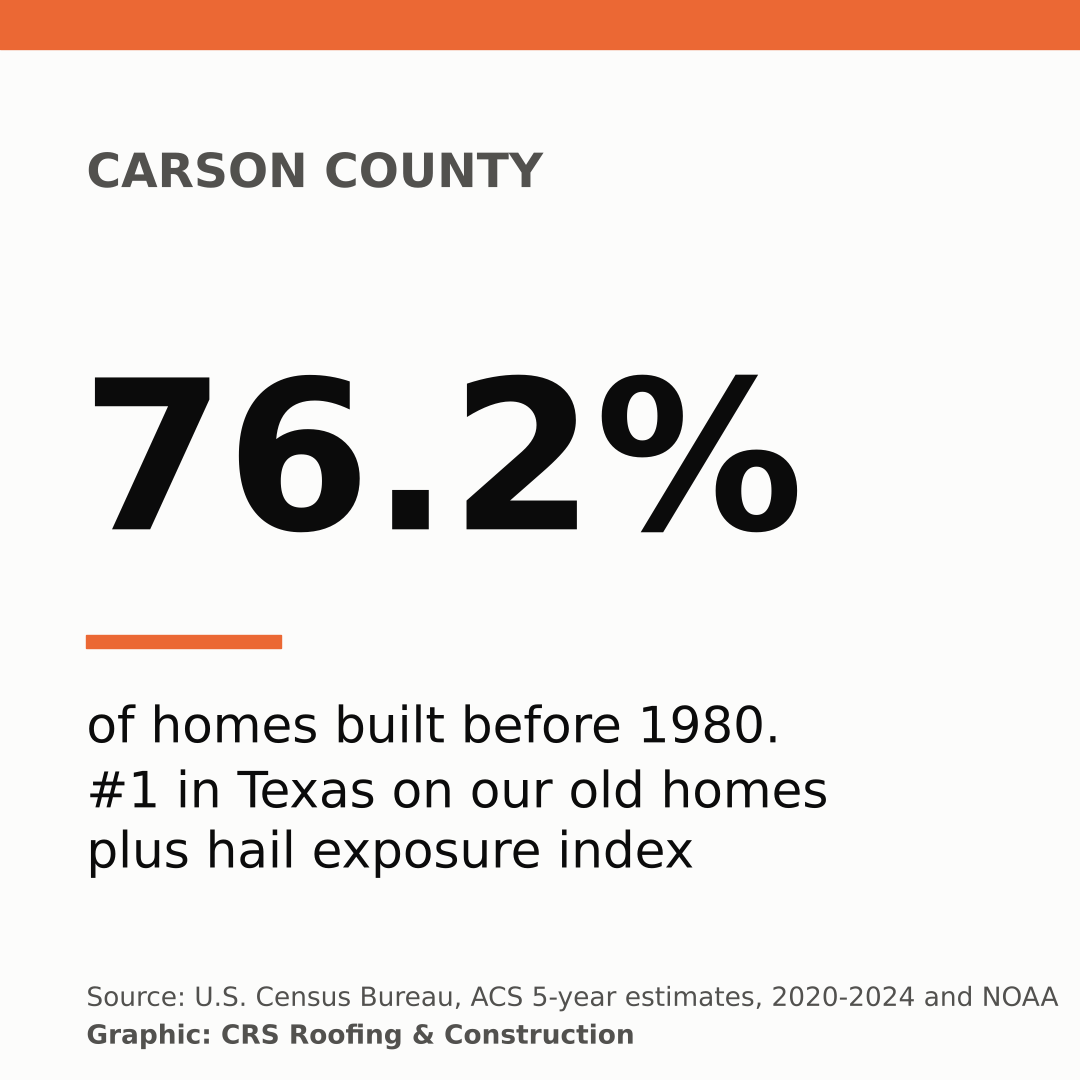
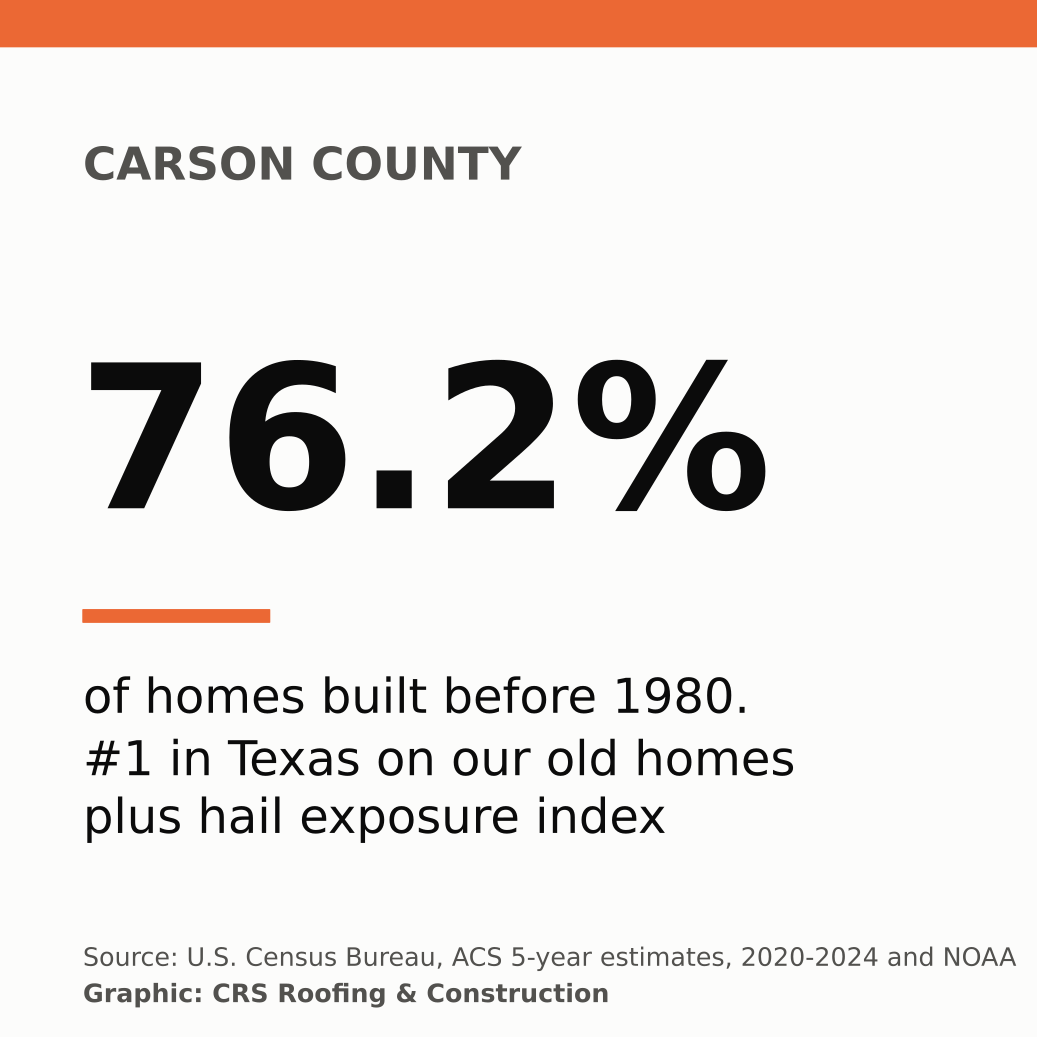
- Old homes and heavy hail overlap in the Panhandle. On our hail exposure and old housing index, Carson, Gray and Potter counties rank #1, #2 and #3 in Texas.
Texas Top 25 Counties by Oldest Median Housing
Ranked by median year structure built (B25035) among the 234 Texas counties with at least 1,000 housing units. Ties are broken by the share built before 1980.
| # | County | Median year built | Built before 1980 | Built before 2000 | Housing units |
|---|---|---|---|---|---|
| 1 | Runnels | 1958 | 76.4% | 92.6% | 4,990 |
| 2 | Hall | 1959 | 89.2% | 95.1% | 1,739 |
| 3 | Carson | 1959 | 76.2% | 91.7% | 2,810 |
| 4 | Collingsworth | 1961 | 85.2% | 93.6% | 1,487 |
| 5 | Swisher | 1961 | 83.3% | 93.4% | 3,029 |
| 6 | Mitchell | 1961 | 78% | 92.2% | 3,691 |
| 7 | Hardeman | 1961 | 77.3% | 89.2% | 1,808 |
| 8 | Gray | 1961 | 75.8% | 91.2% | 9,952 |
| 9 | Floyd | 1962 | 85% | 93.3% | 2,592 |
| 10 | Dickens | 1962 | 74.1% | 84.6% | 1,151 |
| 11 | Dawson | 1963 | 80.1% | 95% | 4,903 |
| 12 | Fisher | 1963 | 78% | 90.9% | 2,016 |
| 13 | Potter | 1963 | 69.6% | 86.5% | 49,390 |
| 14 | Childress | 1963 | 67.3% | 82.4% | 2,772 |
| 15 | Crosby | 1964 | 81% | 93.8% | 2,659 |
| 16 | Haskell | 1964 | 66.6% | 88.5% | 3,081 |
| 17 | Nolan | 1965 | 75.8% | 93.8% | 7,104 |
| 18 | Terry | 1965 | 75% | 89.9% | 4,789 |
| 19 | Wilbarger | 1965 | 73.9% | 91.1% | 5,845 |
| 20 | Hamilton | 1965 | 68.5% | 82.1% | 4,372 |
| 21 | Lamb | 1966 | 75.8% | 90.3% | 5,885 |
| 22 | Baylor | 1966 | 74.3% | 91% | 2,190 |
| 23 | Knox | 1966 | 74.1% | 94.2% | 1,804 |
| 24 | Howard | 1966 | 73.1% | 87.9% | 14,048 |
| 25 | Lynn | 1966 | 71% | 83.9% | 2,521 |
Highest Share of Homes Built Before 1980
Share of all housing units built in 1979 or earlier (B25034), top 15 Texas counties.
| # | County | Before 1980 | Before 1960 | Median year | Units |
|---|---|---|---|---|---|
| 1 | Hall | 89.2% | 51.4% | 1959 | 1,739 |
| 2 | Collingsworth | 85.2% | 48% | 1961 | 1,487 |
| 3 | Floyd | 85% | 45.3% | 1962 | 2,592 |
| 4 | Swisher | 83.3% | 46.8% | 1961 | 3,029 |
| 5 | Crosby | 81% | 41.6% | 1964 | 2,659 |
| 6 | Dawson | 80.1% | 42.2% | 1963 | 4,903 |
| 7 | Mitchell | 78% | 49.1% | 1961 | 3,691 |
| 8 | Fisher | 78% | 45% | 1963 | 2,016 |
| 9 | Hardeman | 77.3% | 48.5% | 1961 | 1,808 |
| 10 | Runnels | 76.4% | 55.5% | 1958 | 4,990 |
| 11 | Carson | 76.2% | 51% | 1959 | 2,810 |
| 12 | Gray | 75.8% | 49% | 1961 | 9,952 |
| 13 | Nolan | 75.8% | 40.2% | 1965 | 7,104 |
| 14 | Lamb | 75.8% | 34% | 1966 | 5,885 |
| 15 | Terry | 75% | 39% | 1965 | 4,789 |
Panhandle, South Plains and Permian Basin Counties We Serve
Ranks are out of 234 Texas counties. Lower numbers mean older housing. Homeowners can find local help through our Amarillo roofing and Lubbock roofing pages.
| County | Median year (rank) | Before 1980 (rank) | Before 2000 (rank) | Units |
|---|---|---|---|---|
| Swisher | 1961 (#5) | 83.3% (#4) | 93.4% (#8) | 3,029 |
| Gray | 1961 (#8) | 75.8% (#12) | 91.2% (#16) | 9,952 |
| Potter | 1963 (#13) | 69.6% (#28) | 86.5% (#36) | 49,390 |
| Childress | 1963 (#14) | 67.3% (#37) | 82.4% (#59) | 2,772 |
| Hutchinson | 1969 (#35) | 67.6% (#35) | 92.2% (#13) | 10,170 |
| Deaf Smith | 1971 (#40) | 71.6% (#23) | 83.8% (#49) | 6,984 |
| Moore | 1975 (#57) | 60.4% (#49) | 79.3% (#77) | 8,277 |
| Dallam | 1977 (#75) | 54.1% (#78) | 82.6% (#57) | 3,052 |
| Hartley | 1979 (#87) | 52.1% (#87) | 85.1% (#41) | 1,814 |
| Ector | 1984 (#132) | 44.5% (#130) | 68.9% (#155) | 68,899 |
| Lubbock | 1985 (#138) | 43.8% (#133) | 67% (#165) | 139,344 |
| Randall | 1986 (#149) | 42% (#143) | 64.3% (#181) | 61,677 |
| Midland | 1992 (#191) | 32.4% (#188) | 58.4% (#199) | 72,723 |
Chart: Share of Homes Built Before 1980
Large Texas Cities by Housing Age
All Texas places with at least 40,000 housing units, oldest first.
| # | City | Median year | Before 1980 | Before 2000 | Units |
|---|---|---|---|---|---|
| 1 | Wichita Falls | 1972 | 64.2% | 86.3% | 43,371 |
| 2 | Amarillo | 1973 | 60.3% | 78.7% | 89,188 |
| 3 | Abilene | 1975 | 56.1% | 81.1% | 53,156 |
| 4 | Pasadena | 1977 | 56.7% | 83.1% | 53,756 |
| 5 | Garland | 1978 | 54.8% | 81.9% | 86,216 |
| 6 | Beaumont | 1978 | 52.8% | 76% | 52,439 |
| 7 | Tyler | 1978 | 52.6% | 73.6% | 46,019 |
| 8 | San Angelo | 1978 | 52.5% | 80.5% | 44,176 |
| 9 | Waco | 1979 | 50.9% | 70.6% | 61,163 |
| 10 | Odessa | 1980 | 50.6% | 69.4% | 49,871 |
| 11 | Dallas | 1981 | 48.1% | 73.9% | 590,237 |
| 12 | Houston | 1982 | 47% | 69.6% | 1,040,576 |
| 13 | Corpus Christi | 1982 | 46.1% | 74% | 136,279 |
| 14 | Mesquite | 1983 | 40.5% | 84.5% | 53,953 |
| 15 | Lubbock | 1984 | 44.7% | 67.2% | 118,143 |
| 16 | El Paso | 1984 | 44.1% | 70.4% | 265,320 |
| 17 | San Antonio | 1985 | 42.5% | 69.4% | 612,901 |
| 18 | Richardson | 1986 | 43.9% | 68.9% | 47,960 |
| 19 | Irving | 1986 | 35.9% | 72.4% | 102,512 |
| 20 | Arlington | 1986 | 33.4% | 76.5% | 153,137 |
| 21 | Carrollton | 1988 | 26% | 70.2% | 54,365 |
| 22 | Midland | 1989 | 36.3% | 61.2% | 57,260 |
| 23 | Grand Prairie | 1992 | 31% | 60.9% | 71,853 |
| 24 | Plano | 1993 | 18.4% | 68.7% | 117,686 |
| 25 | Fort Worth | 1994 | 33.7% | 56.6% | 373,948 |
| 26 | Austin | 1994 | 28.3% | 56.7% | 483,071 |
| 27 | Brownsville | 1995 | 29.5% | 58.4% | 64,878 |
| 28 | McAllen | 1995 | 25.4% | 58.2% | 55,385 |
| 29 | Killeen | 1996 | 24.6% | 57.1% | 65,793 |
| 30 | Denton | 1997 | 26.9% | 53.1% | 60,531 |
| 31 | Laredo | 1997 | 23.9% | 56% | 84,111 |
| 32 | Lewisville | 1997 | 14.3% | 56.8% | 54,237 |
| 33 | College Station | 1999 | 18.1% | 52% | 51,494 |
| 34 | The Woodlands CDP | 2000 | 7.7% | 50.2% | 46,843 |
| 35 | Round Rock | 2002 | 10.5% | 44.9% | 51,143 |
| 36 | League City | 2003 | 14% | 42% | 44,942 |
| 37 | Pearland | 2003 | 11.4% | 38.2% | 47,560 |
| 38 | New Braunfels | 2006 | 19.8% | 37.1% | 44,517 |
| 39 | Conroe | 2006 | 17.4% | 39% | 42,431 |
| 40 | McKinney | 2007 | 7.8% | 27.2% | 77,617 |
| 41 | Frisco | 2009 | 1.5% | 18.5% | 80,353 |
Hail Exposure and Old Housing Index
This is an index, not a measure of damage or risk to any one home. For each of the 234 counties we took two percentile ranks from 0 to 100: hail reports per year per 1,000 square miles from our Texas hail study (NOAA, 2015 to 2025), and the share of homes built before 1980. The index is the simple average of the two. A score of 90 means a county sits near the top of Texas on both measures.
| # | County | Index | Hail percentile | Old housing percentile | Before 1980 |
|---|---|---|---|---|---|
| 1 | Carson | 94.7 | 93.6 | 95.7 | 76.2% |
| 2 | Gray | 92.9 | 91.4 | 94.4 | 75.8% |
| 3 | Potter | 92.5 | 96.6 | 88.4 | 69.6% |
| 4 | Hutchinson | 89.5 | 94 | 85 | 67.6% |
| 5 | Wichita | 89.5 | 98.7 | 80.3 | 62.9% |
| 6 | Hardeman | 89 | 81.5 | 96.6 | 77.3% |
| 7 | Hansford | 87.3 | 83.7 | 91 | 72.4% |
| 8 | Howard | 87.1 | 82.8 | 91.4 | 73.1% |
| 9 | Jones | 86.2 | 88.4 | 84.1 | 66.7% |
| 10 | Runnels | 85.4 | 74.7 | 96.1 | 76.4% |
| 11 | Donley | 85 | 86.7 | 83.3 | 66.6% |
| 12 | Scurry | 83.9 | 79 | 88.8 | 70.4% |
| 13 | Lipscomb | 83.9 | 80.7 | 87.1 | 69.1% |
| 14 | Hall | 83.5 | 67 | 100 | 89.2% |
| 15 | Wheeler | 83.5 | 80.3 | 86.7 | 68.9% |
| 16 | Deaf Smith | 83 | 75.5 | 90.6 | 71.6% |
| 17 | Nolan | 82 | 69.5 | 94.4 | 75.8% |
| 18 | McCulloch | 82 | 82.4 | 81.5 | 63.7% |
| 19 | Mitchell | 81.3 | 65.7 | 97 | 78% |
| 20 | Sherman | 81.3 | 76.8 | 85.8 | 68.3% |
CRS counties on the index: Swisher #45, Gray #2, Potter #3, Childress #28, Hutchinson #4, Deaf Smith #16, Moore #22, Dallam #69, Hartley #53, Ector #43, Lubbock #59, Randall #48, Midland #84.
Typical Roof Lifespans by Material
General guidance only, not a result of this study. These ranges are the service lives CRS Roofing & Construction sees in the Texas Panhandle, where hail, wind and sun shorten roof life. Read the full breakdown in how long roofs last in the Texas Panhandle.
| Material | Typical Panhandle lifespan |
|---|---|
| 3-tab asphalt shingles | 12 to 15 years |
| Architectural shingles | 18 to 25 years |
| Class 4 impact-resistant shingles | 20 to 28 years |
| Exposed-fastener metal (R-panel) | 25 to 35 years |
| Standing-seam metal | 40 to 60 years |
| TPO or EPDM membrane (commercial) | 20 to 30 years |
Methodology
- Source. U.S. Census Bureau American Community Survey 2020-2024 5-year estimates (the 2024 5-year release), table B25034 (Year Structure Built) and B25035 (Median Year Structure Built), downloaded from the Census Bureau's table-based summary files in October 2026.
- Shares. "Before 1980" is units built 1979 or earlier. "Before 2000" is units built 1999 or earlier. Both are divided by total housing units.
- Which counties. All 254 Texas counties were downloaded. Rankings include the 234 counties with at least 1,000 housing units. The 20 smaller counties (Armstrong, Borden, Briscoe, Cottle, Edwards, Foard, Glasscock, Irion, Kenedy, Kent, King, Loving, McMullen, Motley, Oldham, Roberts, Sterling, Stonewall, Terrell, Throckmorton) have very wide margins of error and were left out of the rankings.
- Cities. Census places in Texas with at least 40,000 housing units. States are the 50 states, not D.C. or Puerto Rico.
- Index. Percentile rank of hail reports per 1,000 square miles per year plus percentile rank of pre-1980 share, divided by two. Equal weights are a choice, not a finding.
Caveats
- The year a house was built is not the age of its roof. Most older homes have been re-roofed, often more than once in hail country. This study shows where housing is oldest, not where roofs are oldest. No public dataset tracks roof age by county.
- Housing units include all types. B25034 counts houses, apartments and mobile homes together.
- These are survey estimates. ACS figures carry margins of error. Medians in small counties can shift by several years. Year built is reported by residents and is less reliable for older homes.
- Hail reports favor populated areas. The hail half of the index uses NOAA reports, which depend on people seeing and reporting hail.
Free to Use
Free to use with credit and a link to CRS Roofing & Construction. Please cite "CRS Roofing & Construction analysis of U.S. Census Bureau ACS data" and link to https://crsroofer.com/texas-oldest-homes-roof-age-study.
Texas Oldest Homes Study FAQ
Which Texas county has the oldest homes?
Among the 234 Texas counties with at least 1,000 housing units, Runnels County has the oldest median year built, 1958. Hall County has the highest share of homes built before 1980, at 89.2%. Source: U.S. Census Bureau ACS 2020-2024 5-year estimates.
How old are homes in Amarillo?
The median Amarillo housing unit was built in 1973, and 60.3% were built before 1980. That makes Amarillo the #2 oldest of 41 large Texas cities in this study. Potter County's median is 1963 and Randall County's is 1986.
How old are homes in Lubbock?
The median Lubbock city housing unit was built in 1984, and 44.7% were built before 1980. Lubbock County's median is 1985, #138 of 234 Texas counties.
Does an old house mean an old roof?
No. Year built describes the house, not the roof. Most homes built before 1980 have been re-roofed at least once, and many Panhandle homes have been re-roofed several times after hail. The data shows where the housing stock is oldest, which is where original decking, older framing and repeated re-roofs are most common.
How does Texas compare to other states?
Texas housing is young. The statewide median year built is 1992, compared with 1980 for the U.S. Texas ranks #46 of 50 states from oldest to newest. Only 33.2% of Texas housing units were built before 1980, versus 49.7% nationally.
Can I use this data in a story?
Yes. The tables and chart are free to use with credit and a link to CRS Roofing & Construction at https://crsroofer.com/texas-oldest-homes-roof-age-study.
Media kit: download graphics
Maps, charts and square stat cards sized for TV (1920x1080) and social (1080x1080), in PNG and SVG. Free to use with credit to CRS Roofing & Construction.