Texas Panhandle Winter Storm Study: Snow, Ice and Blizzards (2015 to 2025)
A CRS Roofing & Construction data study. Sources: NOAA NCEI Storm Events Database (2015 through 2025) and NOAA GHCN-Daily snowfall for Amarillo and Lubbock.
Headline finding
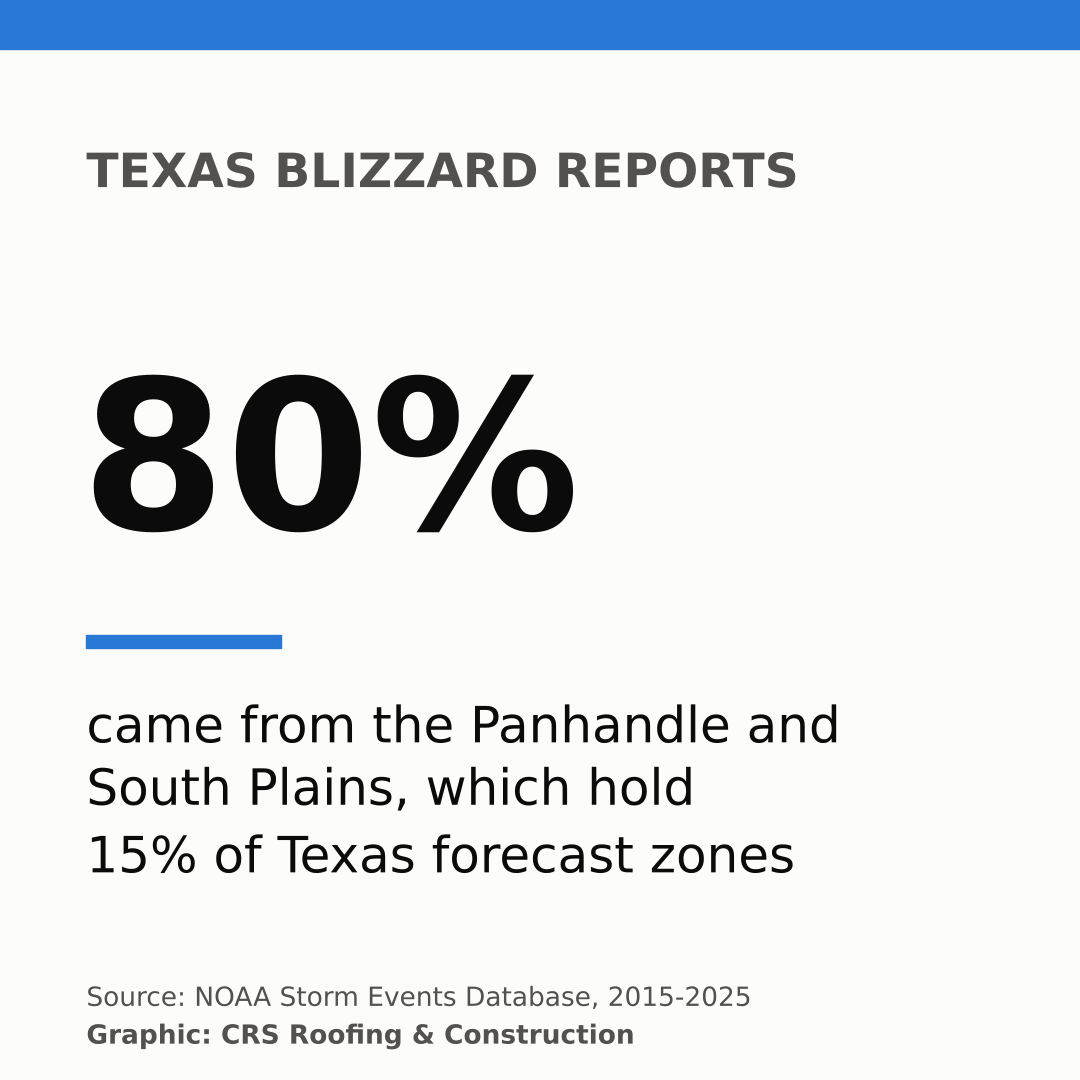
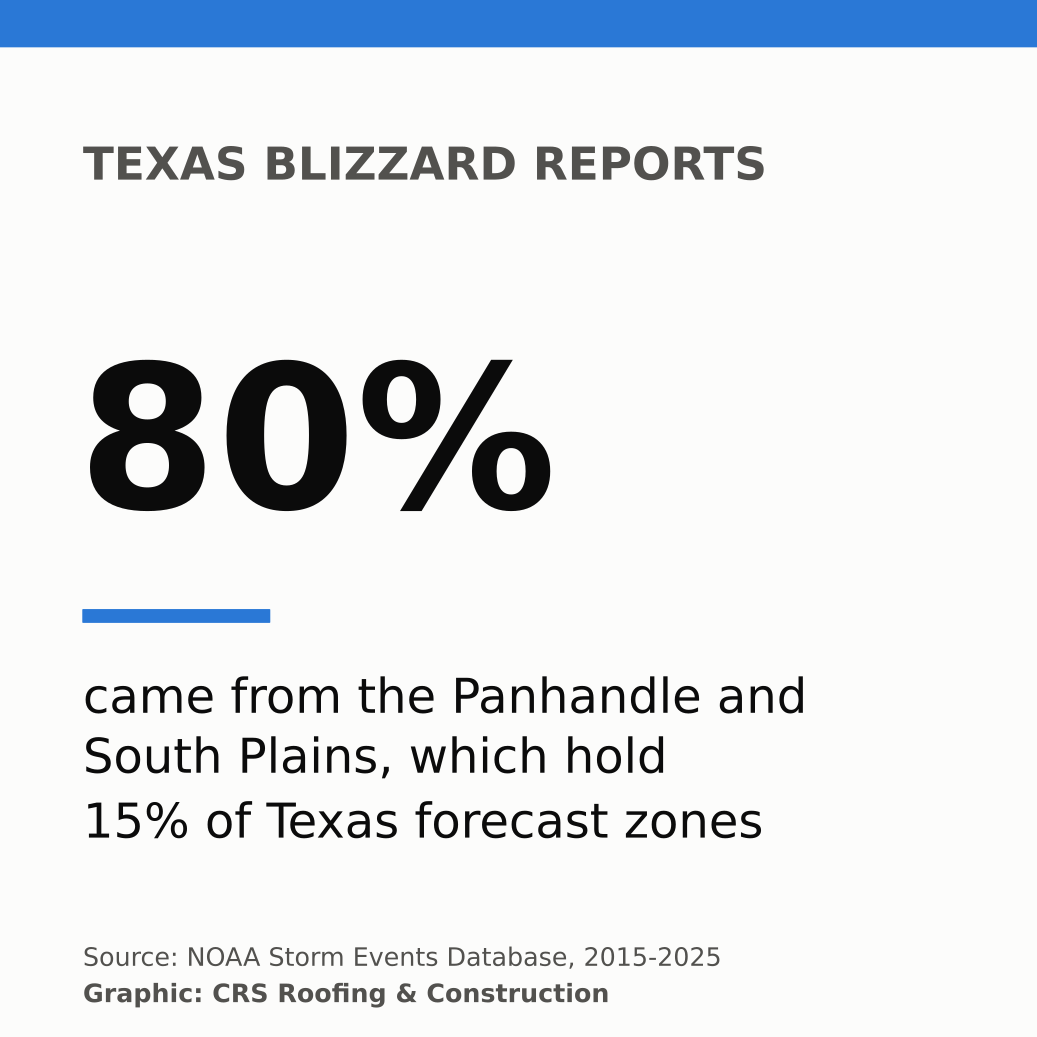
The Texas Panhandle and South Plains make up 45 of 300 Texas forecast zones (15%), yet they logged 45 of the state's 56 blizzard reports (80.4%) from 2015 through 2025. All 10 of the most blizzard-prone zones in Texas are in this region.
80.4%
Share of Texas blizzard reports from Panhandle and South Plains zones
12.4 in
Average seasonal snowfall in Amarillo, 2015-16 to 2024-25 (Lubbock: 5.4 in)
December 9
Median first measurable snow in Amarillo, 2015-16 to 2024-25
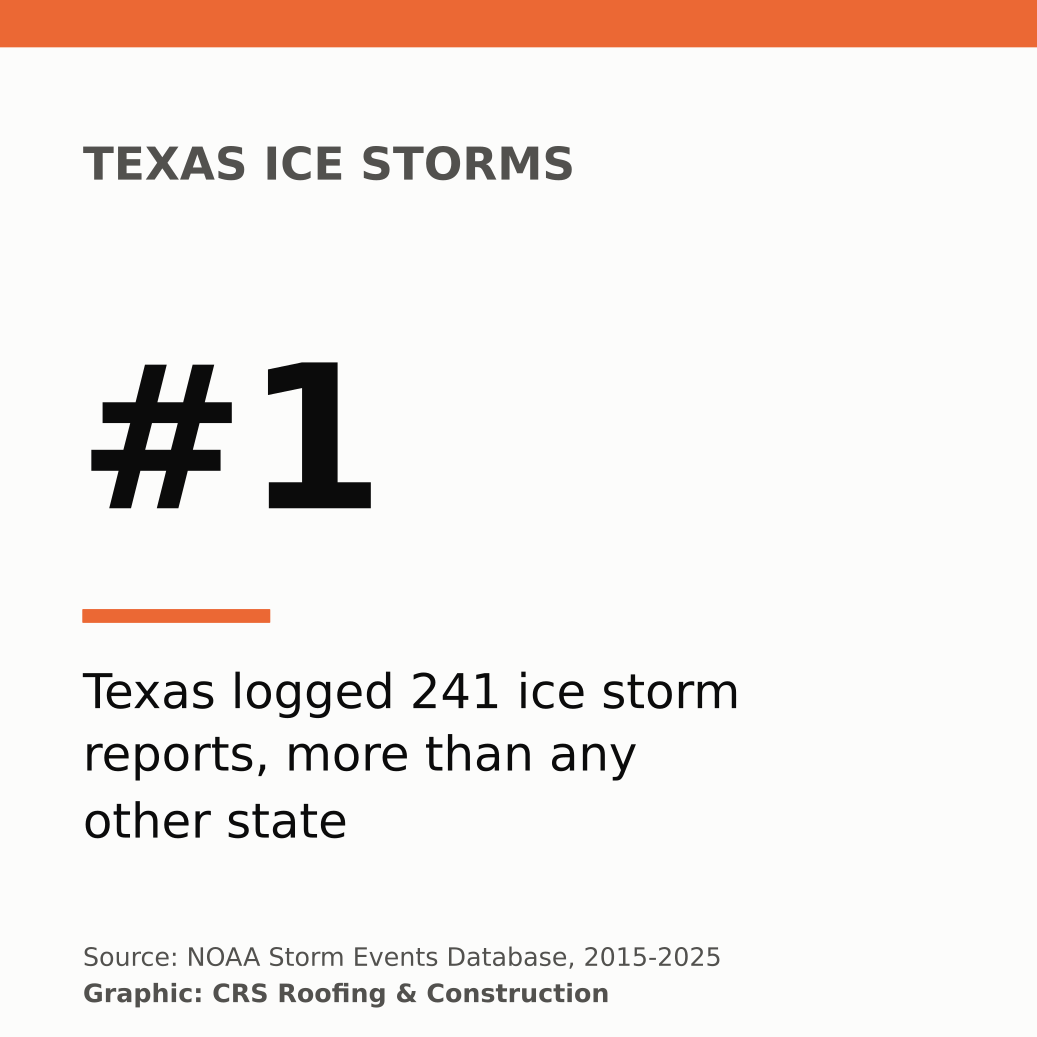
241
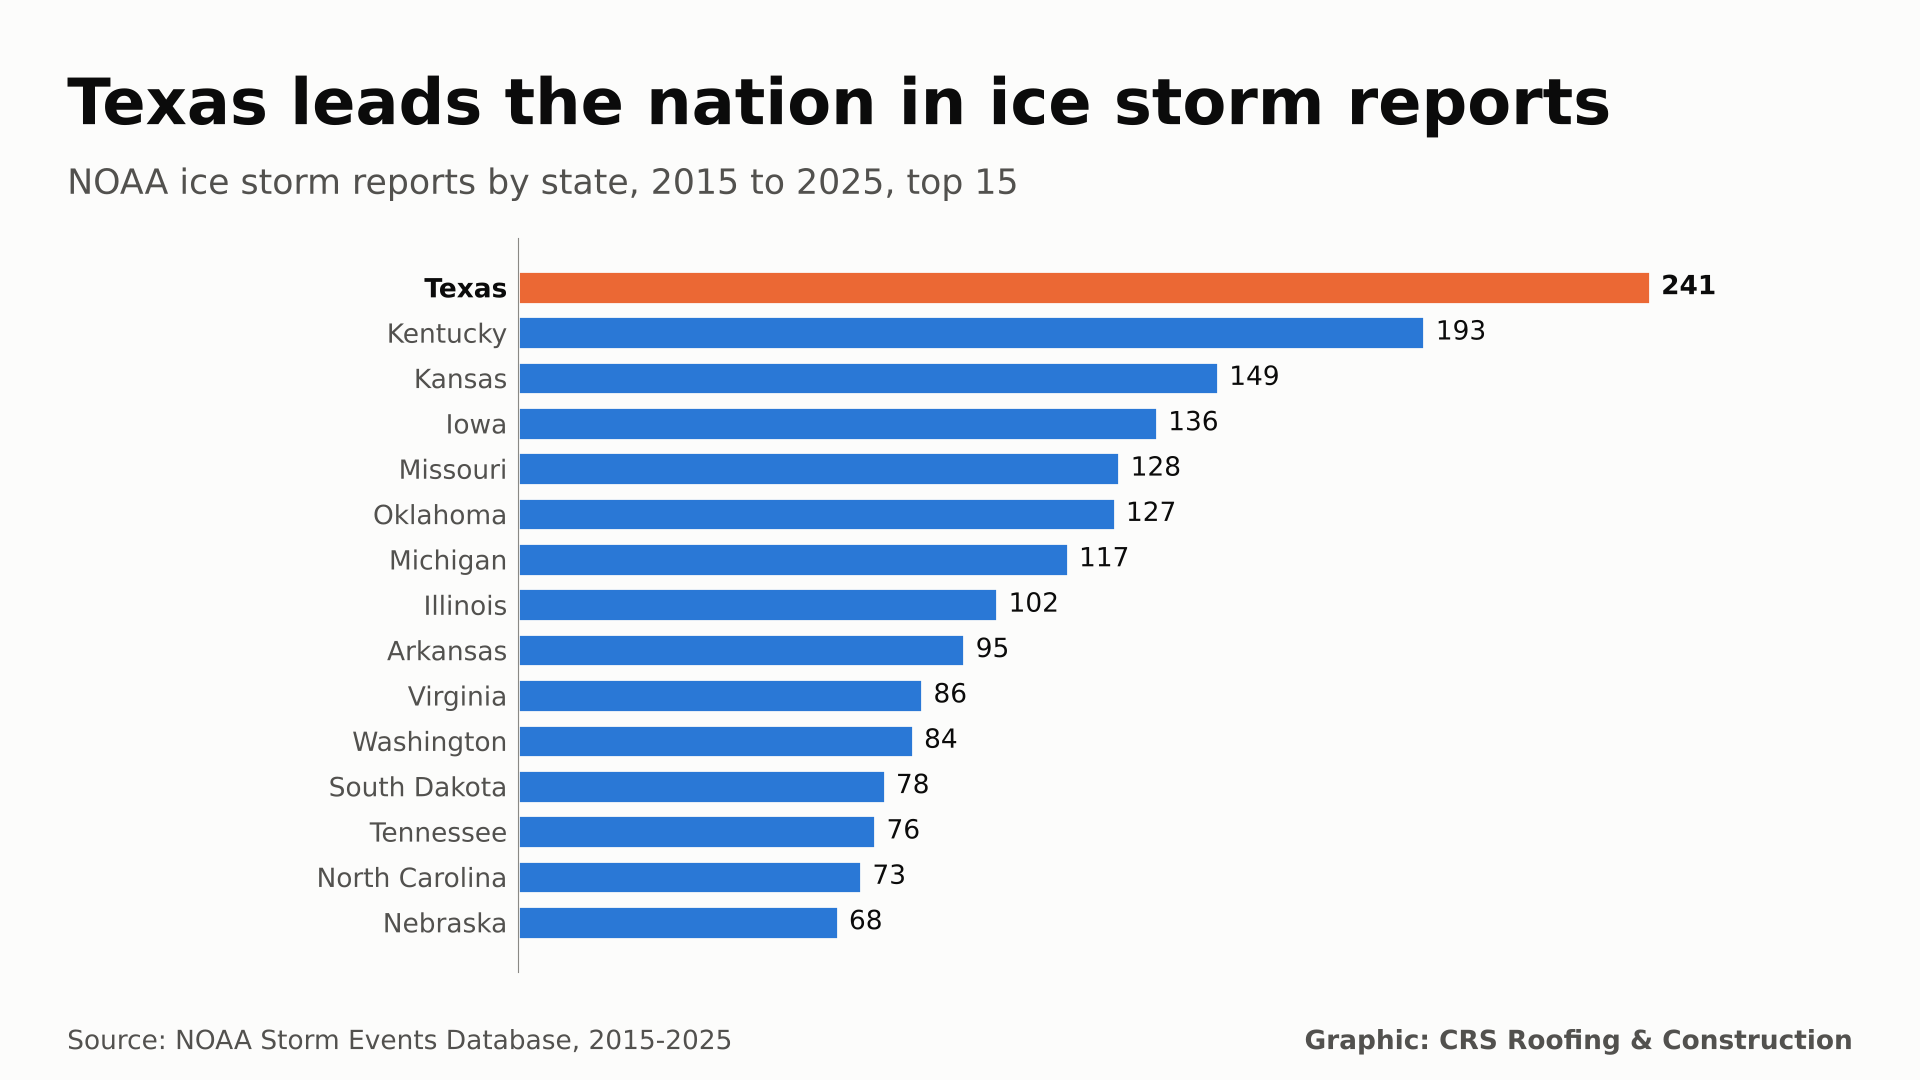
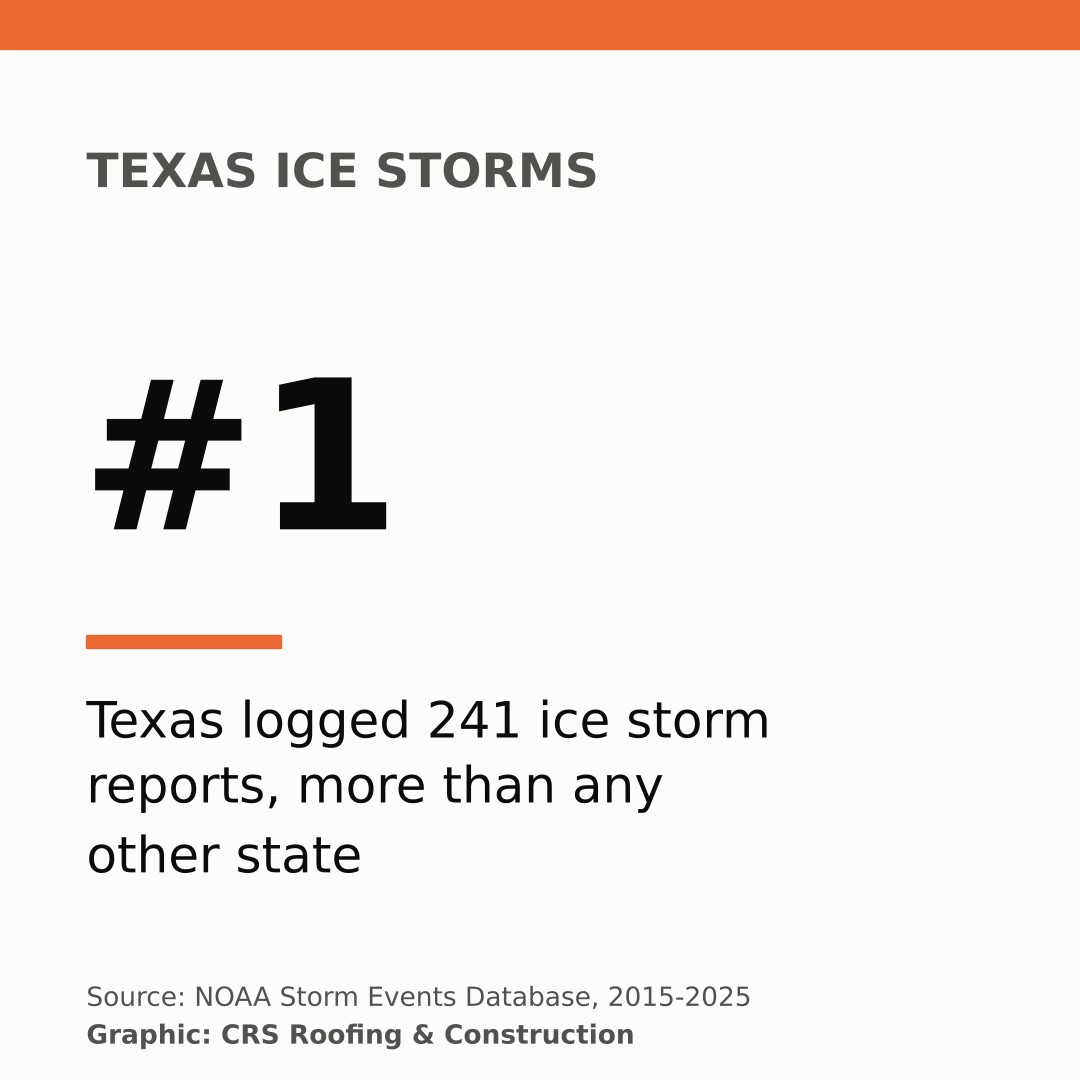
Texas Ice Storm reports, 2015 to 2025 (#1 of 50 states)
Key Findings
- Blizzard country is the Panhandle. 45 of 56 Texas blizzard reports (80.4%) came from the 45 Panhandle and South Plains zones. Dallam and Hartley lead the state with 3 blizzard reports each.
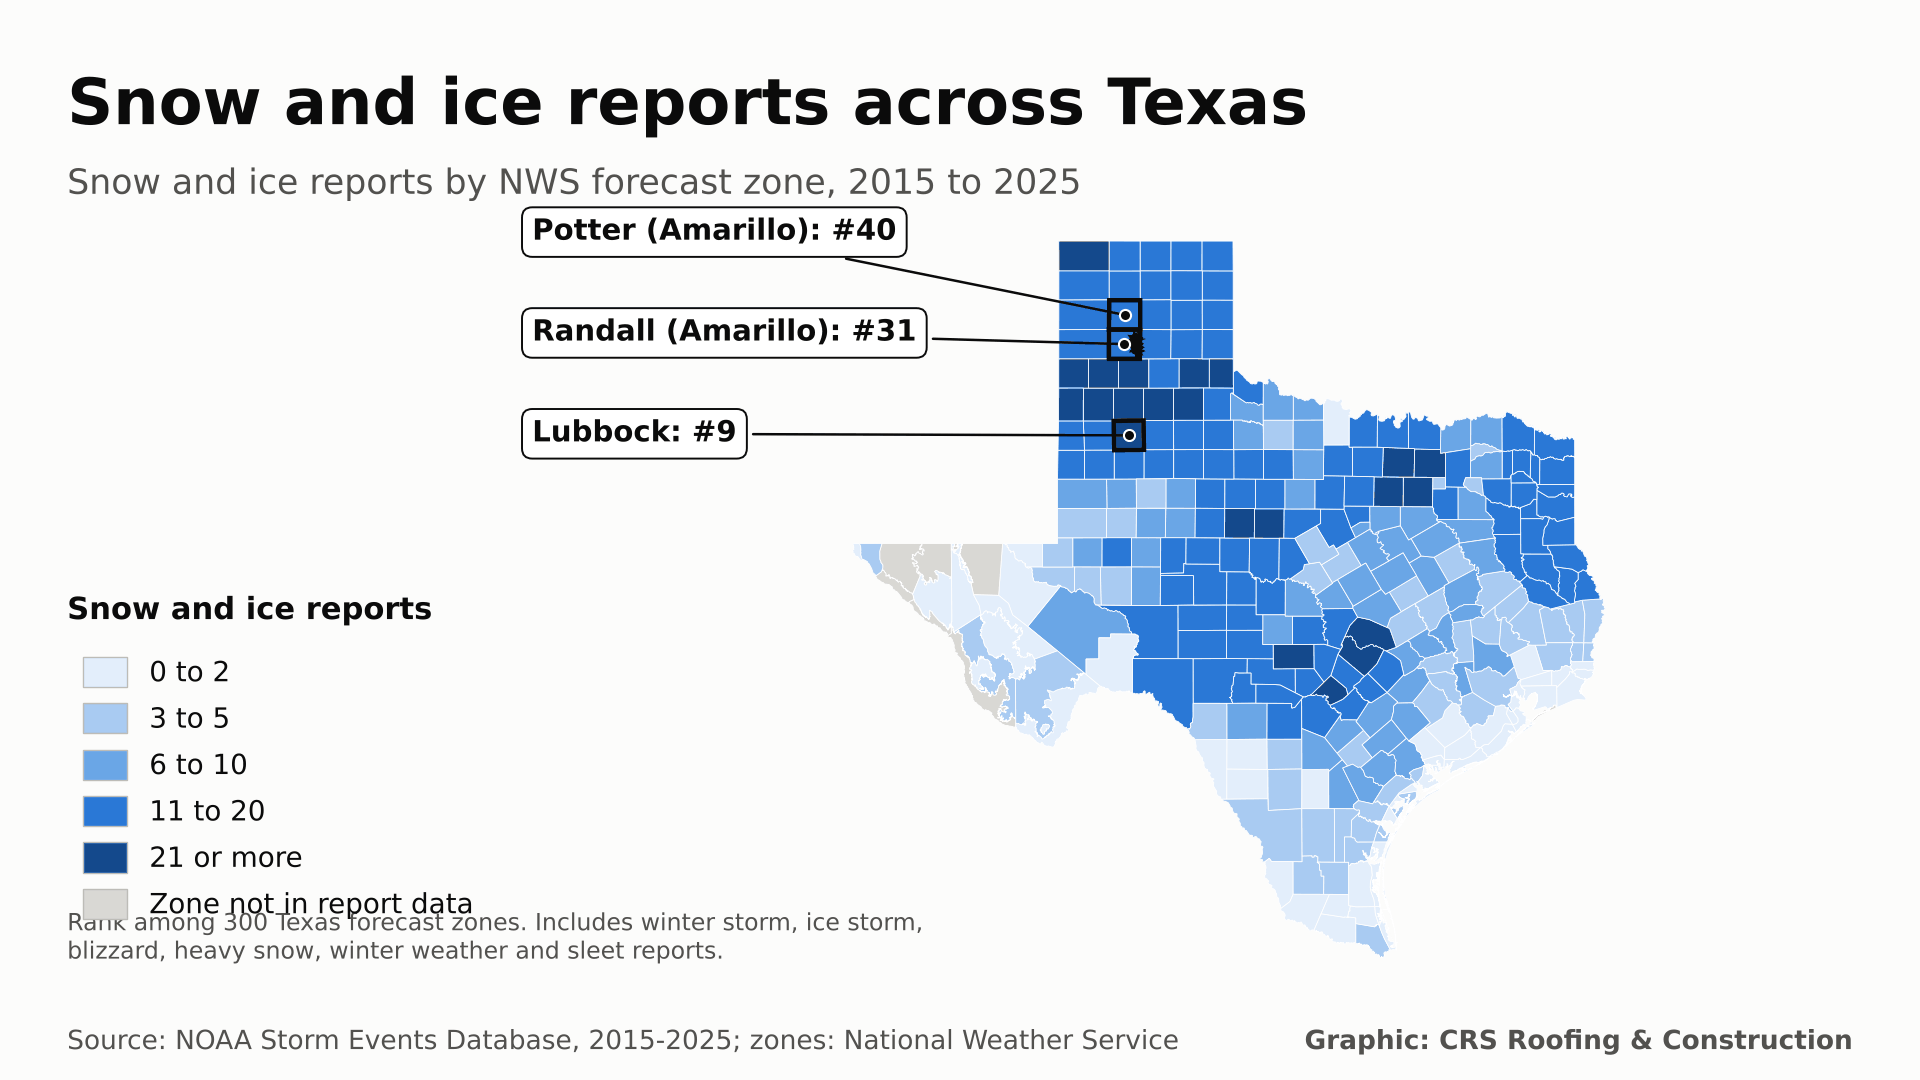
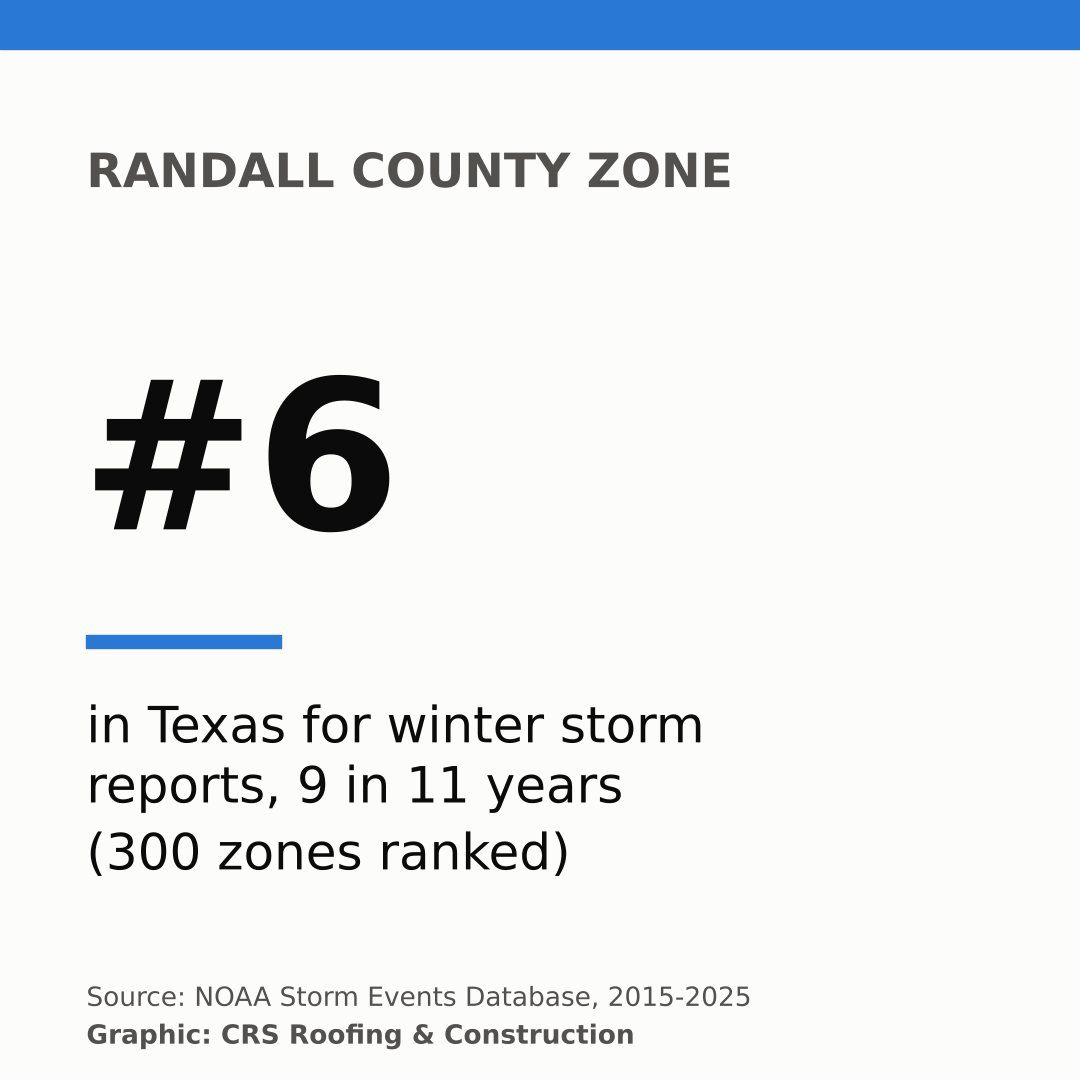
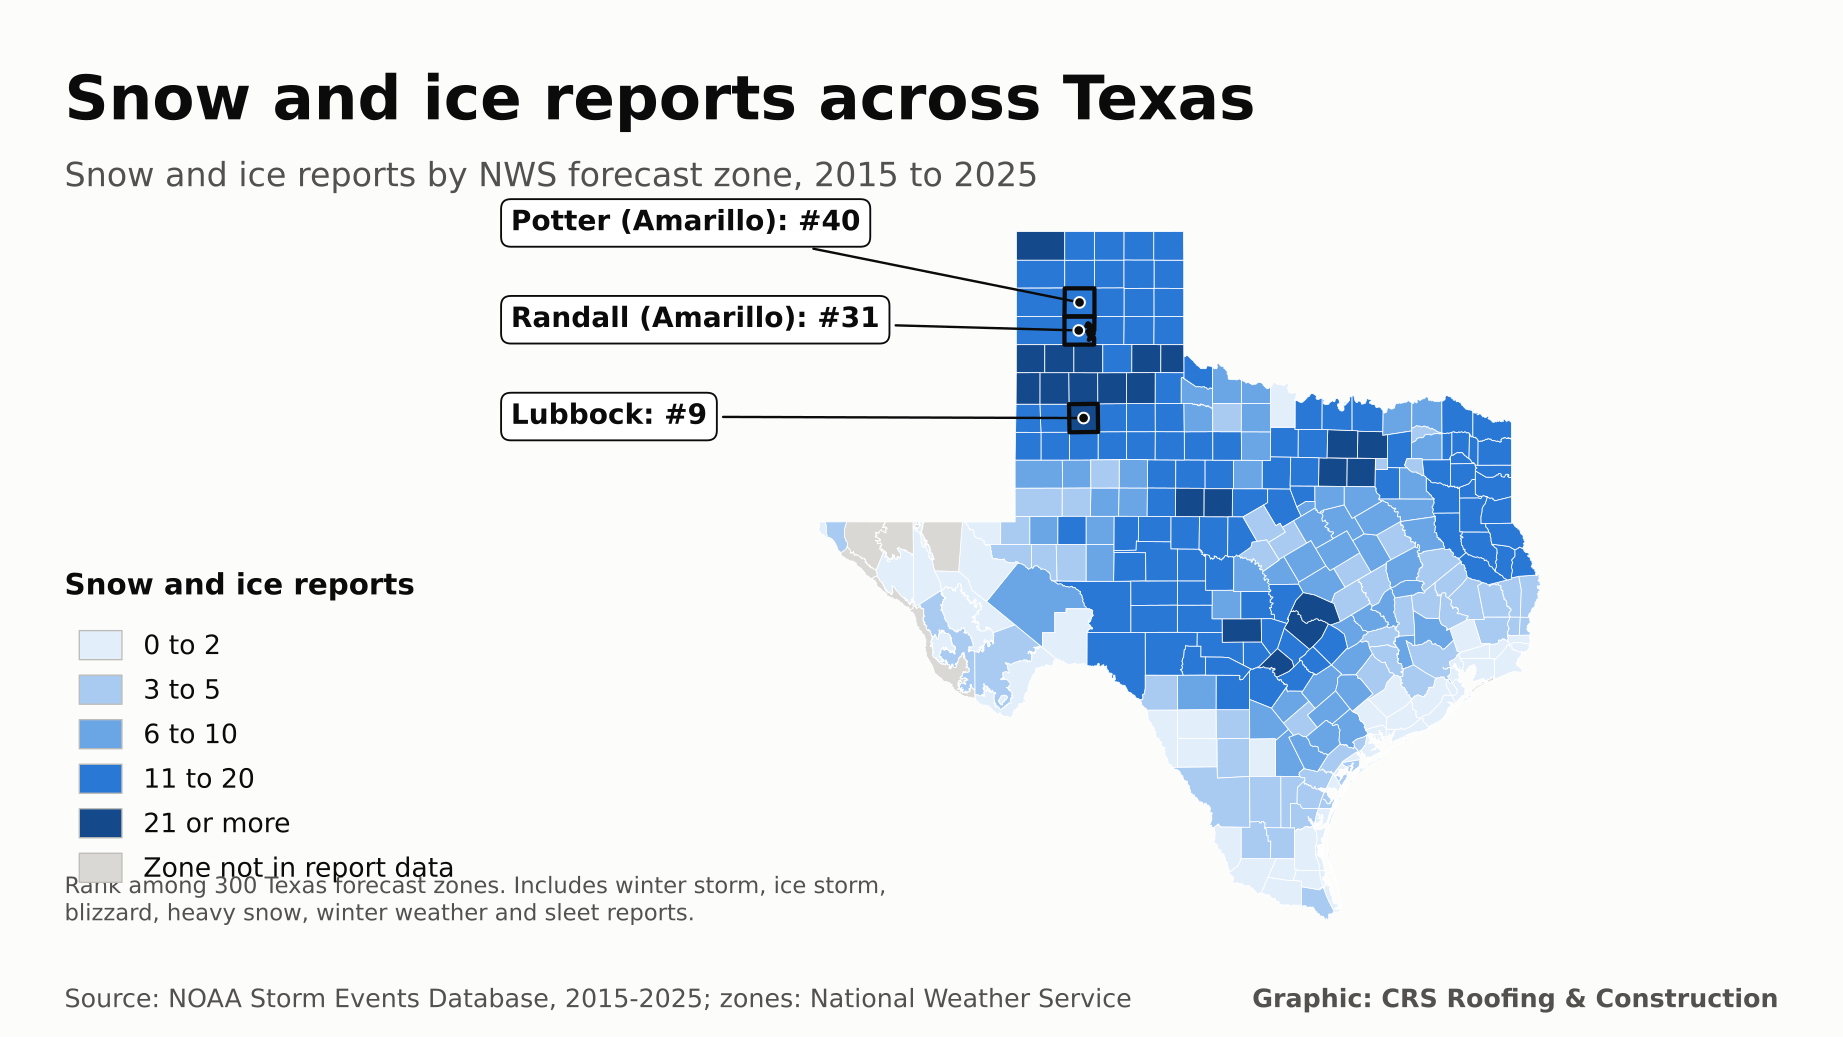
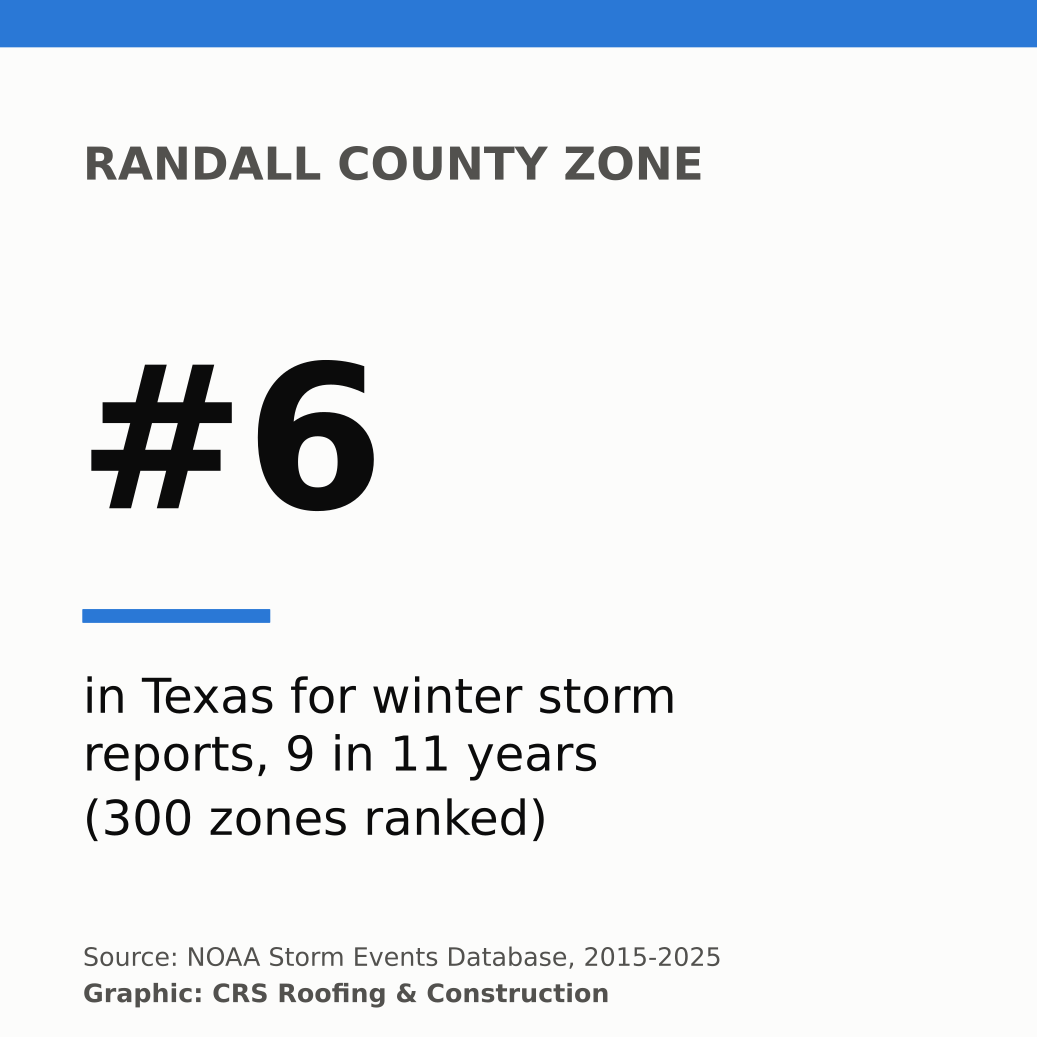
- Amarillo ranks near the top for winter storms. The Randall County zone logged 9 Winter Storm reports, #6 of 300 Texas zones. Potter County logged 7 (#21). The Lubbock zone ranked #9 in Texas for all snow and ice reports combined, with 26.
- Amarillo averages about a foot of snow a season, Lubbock about five inches. Amarillo averaged 12.4 inches per season from 2015-16 through 2024-25 and Lubbock 5.4 inches. Both are below their 1991 to 2020 averages (17.7 and 7.1 inches), but single seasons vary a lot: Amarillo got 33.8 inches in 2020-21.
- The biggest storms dump close to a foot in a day. Amarillo's largest snow day in the study years was 11 inches on January 21, 2015. Lubbock's was 11 inches on December 27, 2015, during the late December 2015 blizzard. Amarillo's all-time record day in the station data is 19 inches on February 25, 2013.
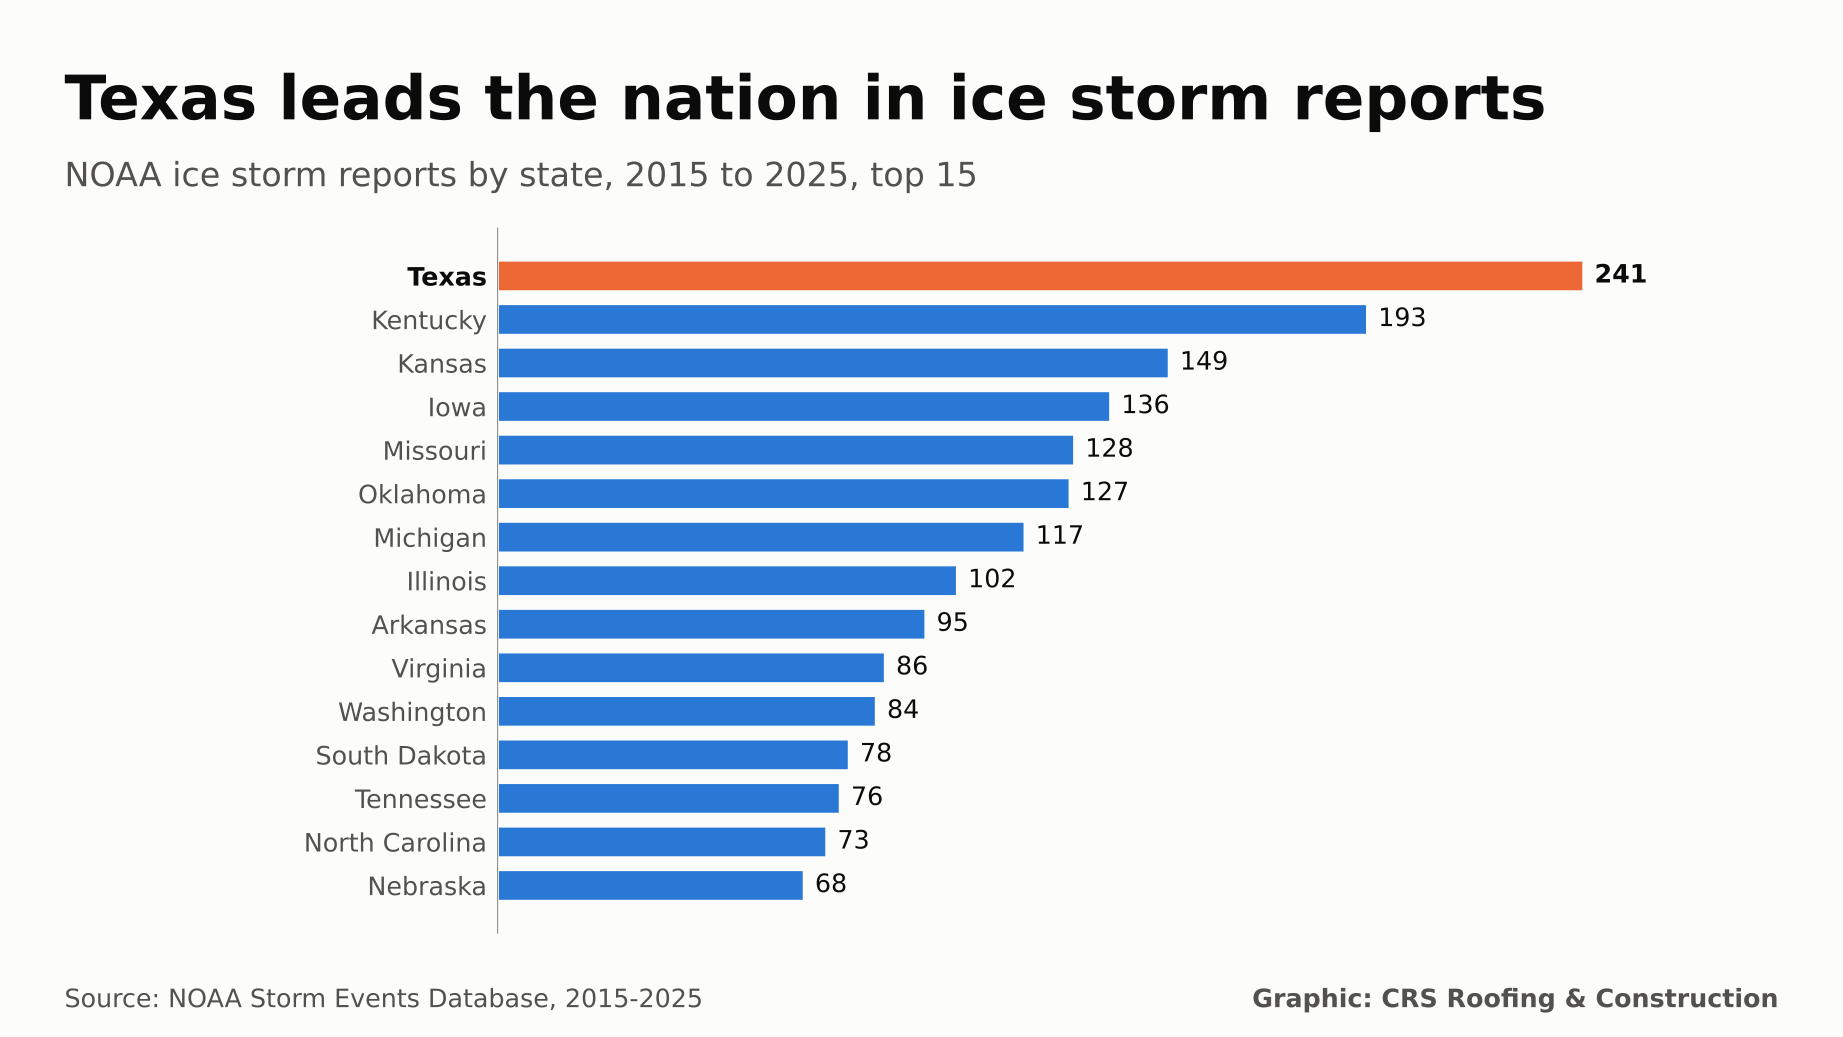
- Texas leads the nation in ice storm reports and winter damage dollars. Texas logged 241 Ice Storm reports, ahead of every other state, and $416.3 million in reported property damage from all winter and cold event types, also #1. $277.2 million of that was reported in 2021, the year of the February freeze. NOAA damage figures are incomplete and should be read as a floor.
Winter Season Calendar: Amarillo vs. Lubbock
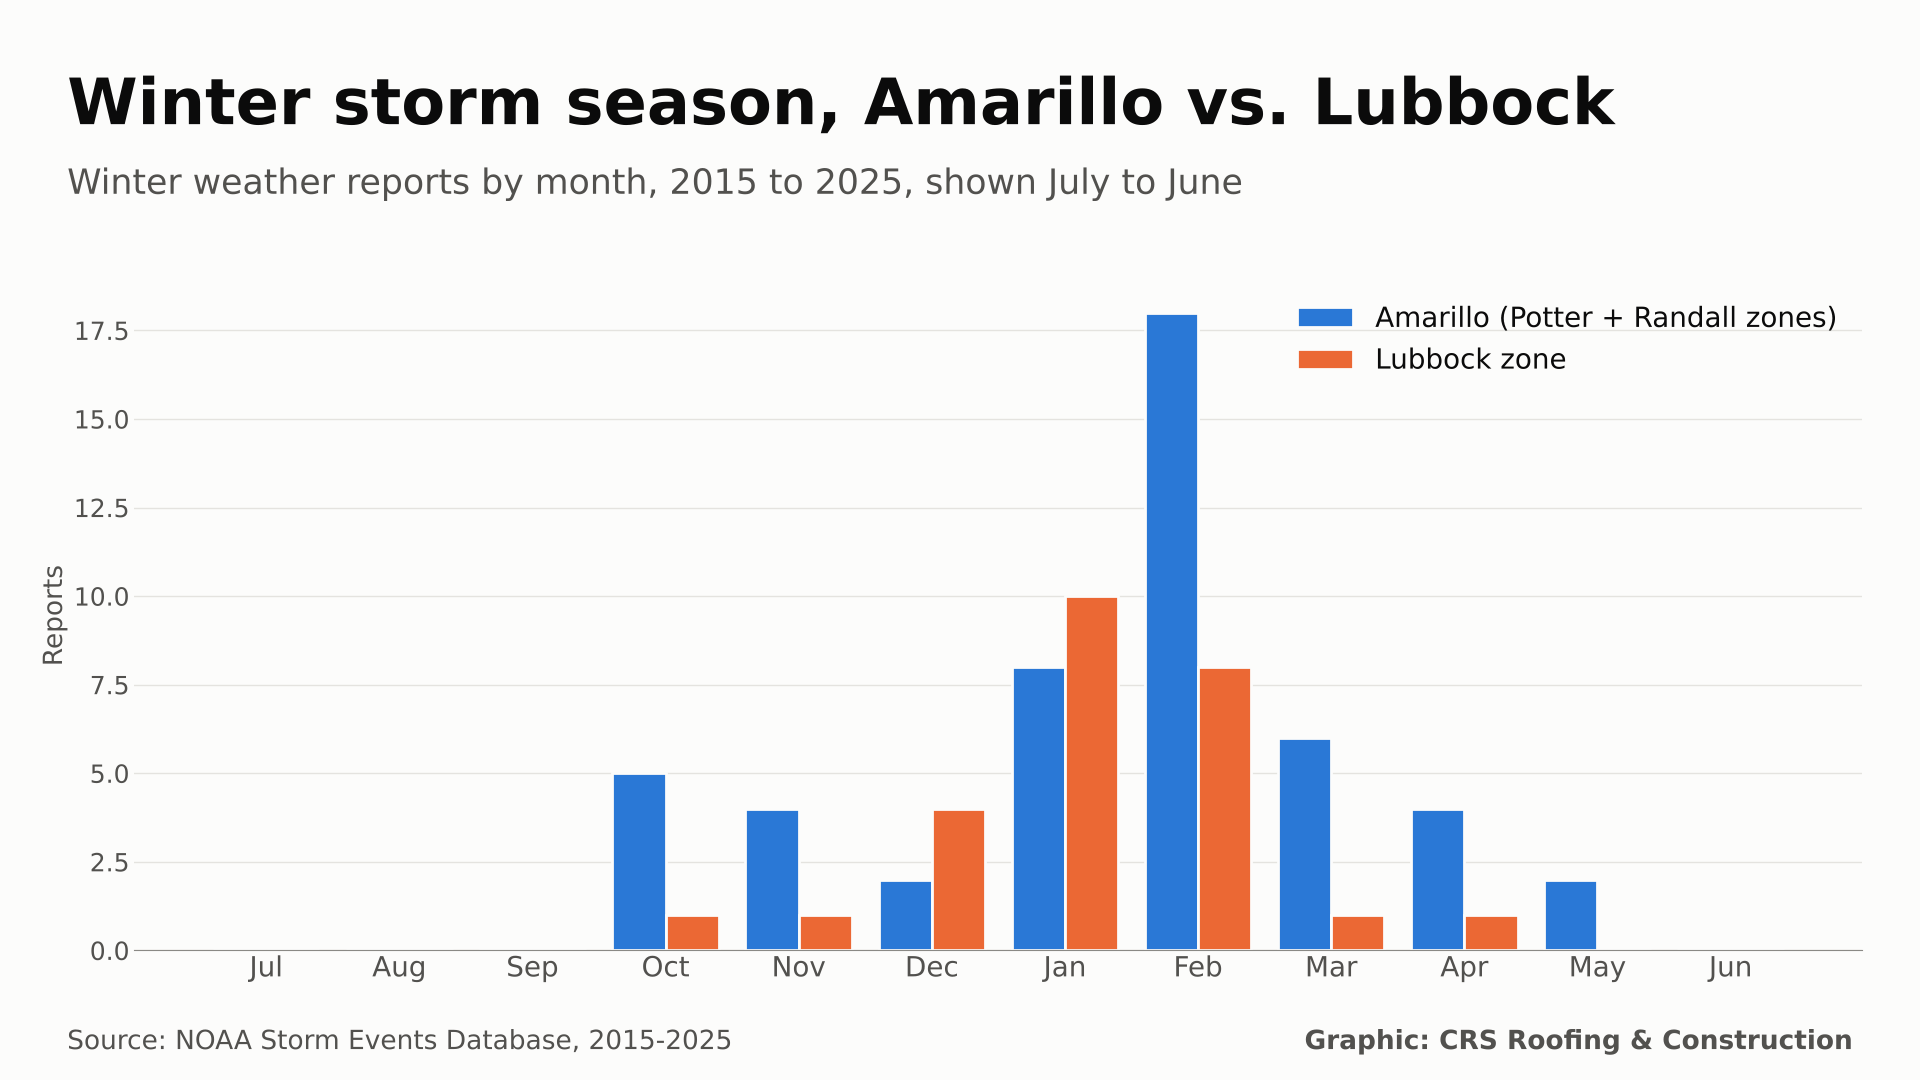
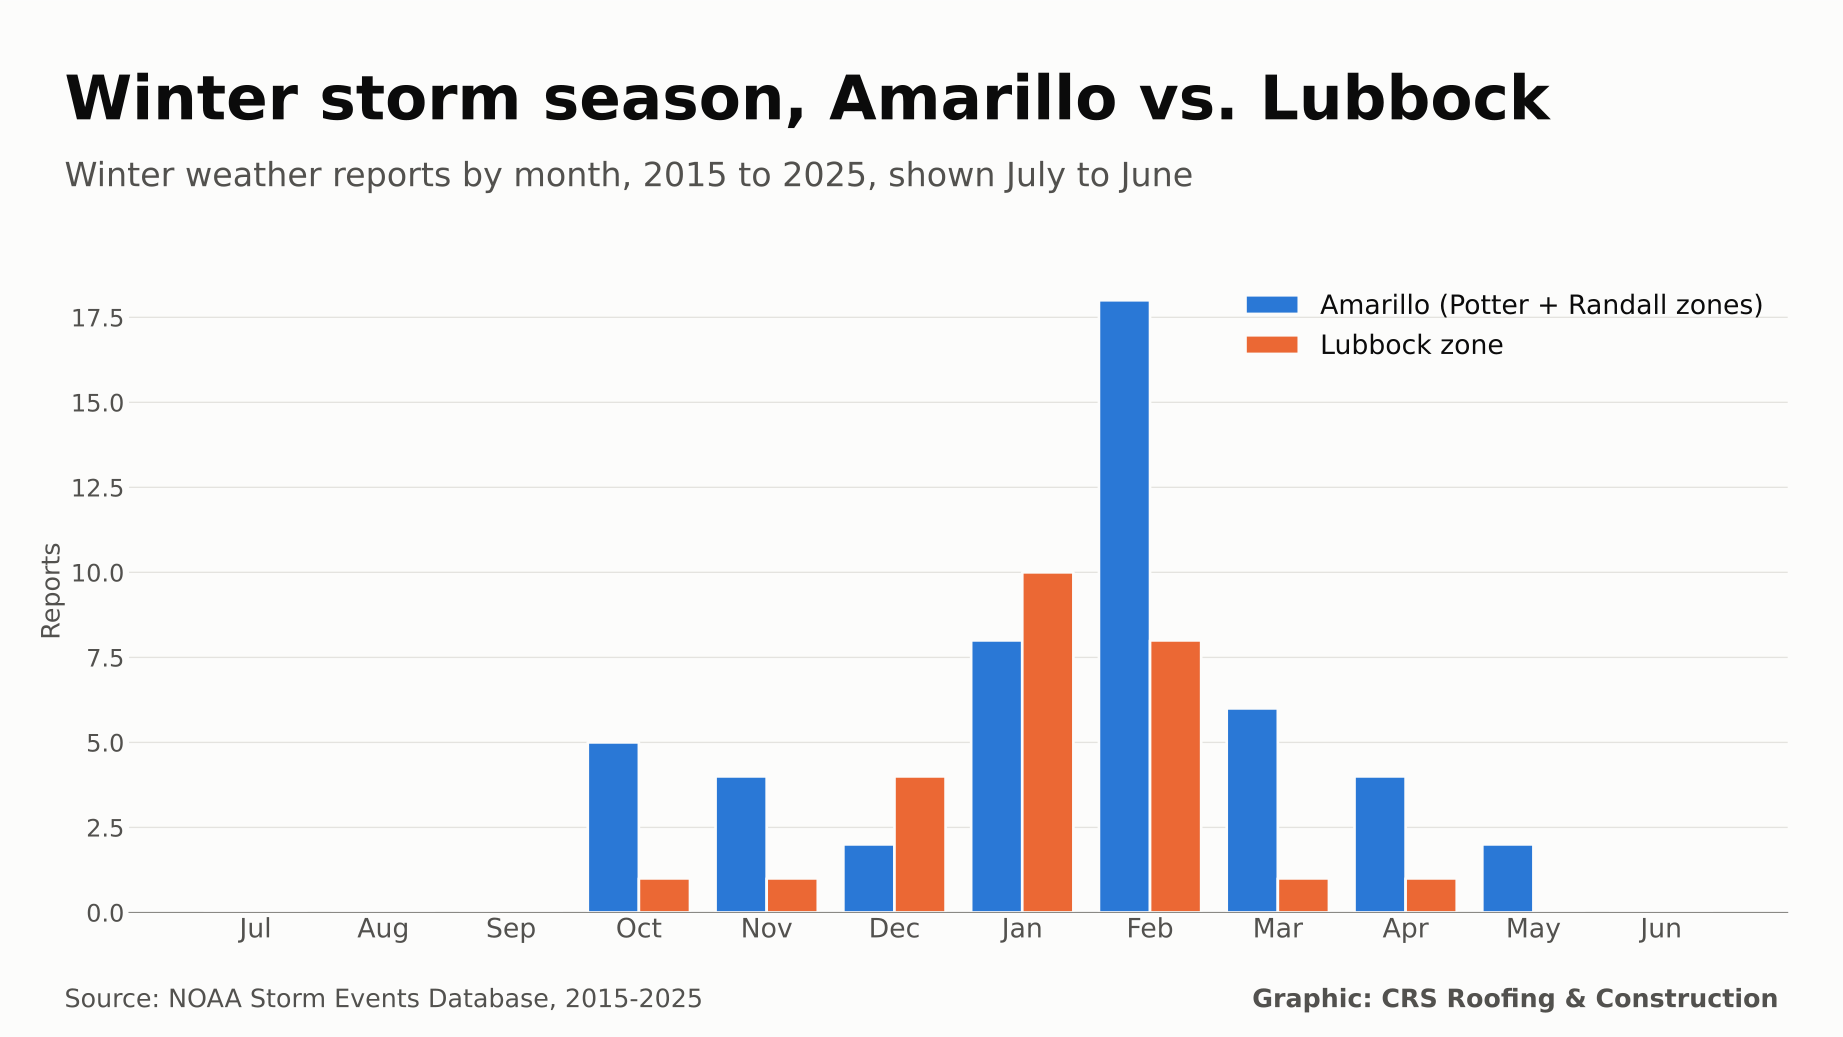
Average snowfall by month, 2015-16 through 2024-25 seasons, from NOAA GHCN-Daily records at the Amarillo (USW00023047) and Lubbock (USW00023042) airport weather stations. February is Amarillo's snowiest month and December is Lubbock's. Across Panhandle and South Plains zones, February had the most Storm Events winter reports (294 of 953, or 31%).
Amarillo and Lubbock Snow by the Numbers
Measurable snow means 0.1 inch or more in a day. Season runs July 1 through June 30. The study period covers the 2015-16 through 2024-25 seasons.
| Measure | Amarillo | Lubbock |
|---|---|---|
| Average seasonal snowfall, 2015-16 to 2024-25 | 12.4 in | 5.4 in |
| Average seasonal snowfall, 1991-92 to 2020-21 | 17.7 in | 7.1 in |
| Median first measurable snow (study / 1991 to 2020) | December 9 / November 24 | January 1 / December 3 |
| Median last measurable snow (study / 1991 to 2020) | March 28 / March 24 | February 2 / February 28 |
| Earliest first snow, study seasons | October 24, 2019 | October 24, 2019 |
| Latest last snow, study seasons | April 30, 2017 | April 5, 2025 |
| Biggest snow day, 2015 to 2025 | 11 in (January 21, 2015) | 11 in (December 27, 2015) |
| Biggest snow day, full station record | 19 in (February 25, 2013) | 12.1 in (February 20, 1961) |
| Season | Amarillo snow (in) | Amarillo first snow | Lubbock snow (in) | Lubbock first snow |
|---|---|---|---|---|
| 2015-16 | 13.5 | 2015-11-26 | 13.3 | 2015-12-26 |
| 2016-17 | 10 | 2016-12-17 | 0.2 | 2017-01-06 |
| 2017-18 | 0 | None | 0.3 | 2017-12-31 |
| 2018-19 | 8.2 | 2018-11-11 | 10.1 | 2018-12-08 |
| 2019-20 | 11.9 | 2019-10-24 | 2.2 | 2019-10-24 |
| 2020-21 | 33.8 | 2020-10-26 | 12 | 2020-10-27 |
| 2021-22 | 16.1 | 2022-01-01 | 2.7 | 2022-01-01 |
| 2022-23 | 3.8 | 2022-12-16 | 7.2 | 2023-01-24 |
| 2023-24 | 8.4 | 2023-12-09 | 3.7 | 2024-02-11 |
| 2024-25 | 17.9 | 2025-01-07 | 2.5 | 2025-01-09 |
Biggest Winter Storms in the Panhandle and South Plains
Storm Events reports from the Amarillo and Lubbock National Weather Service offices, grouped into single storms when their dates overlap, and ranked by the number of zones with a Blizzard, Heavy Snow, Winter Storm or Ice Storm report. The region has 45 zones. Across 2015 to 2025 the data holds 35 storms at that level, 4 with blizzard reports and 7 with ice storm reports.
| Dates | Zones | Blizzard | Heavy snow | Winter storm | Ice storm | Reported damage |
|---|---|---|---|---|---|---|
| 2020-10-25 to 2020-10-29 | 45 | 0 | 6 | 30 | 9 | $0 |
| 2015-12-26 to 2015-12-28 | 41 | 33 | 0 | 7 | 1 | $32.6 million |
| 2015-11-26 to 2015-11-28 | 35 | 0 | 0 | 0 | 36 | $2.4 million |
| 2021-02-14 to 2021-02-15 | 24 | 0 | 0 | 24 | 0 | $0 |
| 2015-01-21 to 2015-01-22 | 39 | 0 | 8 | 15 | 0 | $0 |
| 2024-02-10 to 2024-02-11 | 37 | 0 | 0 | 22 | 0 | $40,000 |
| 2025-01-09 to 2025-01-10 | 30 | 1 | 5 | 15 | 0 | $0 |
| 2023-01-24 | 27 | 0 | 14 | 5 | 0 | $0 |
| 2021-03-17 | 18 | 0 | 0 | 18 | 0 | $0 |
| 2021-01-09 to 2021-01-10 | 24 | 0 | 0 | 16 | 0 | $0 |
Texas Top 25 Zones by Snow and Ice Reports
Ranked by Storm Events reports of Winter Storm, Ice Storm, Heavy Snow, Blizzard, Winter Weather and Sleet, 2015 through 2025. Texas had 300 forecast zones with at least one winter or cold report. Ties share a rank.
| # | Zone | NWS office | Snow and ice | Winter storm | Ice storm | Blizzard | Heavy snow |
|---|---|---|---|---|---|---|---|
| 1 | Tarrant | FWD | 51 | 9 | 1 | 0 | 26 |
| 2 | Dallas | FWD | 37 | 6 | 1 | 0 | 16 |
| 3 | Parmer | LUB | 30 | 3 | 1 | 2 | 7 |
| 3 | Castro | LUB | 30 | 3 | 1 | 2 | 7 |
| 5 | Hall | LUB | 28 | 6 | 1 | 0 | 5 |
| 5 | Motley | LUB | 28 | 5 | 2 | 0 | 5 |
| 5 | Swisher | LUB | 28 | 3 | 1 | 1 | 5 |
| 8 | Collin | FWD | 27 | 5 | 1 | 0 | 17 |
| 9 | Childress | LUB | 26 | 5 | 2 | 0 | 1 |
| 9 | Lubbock | LUB | 26 | 4 | 2 | 1 | 3 |
| 9 | Bailey | LUB | 26 | 3 | 0 | 1 | 5 |
| 12 | Williamson | EWX | 25 | 11 | 0 | 0 | 0 |
| 12 | Denton | FWD | 25 | 7 | 2 | 0 | 12 |
| 12 | Taylor | SJT | 25 | 5 | 2 | 0 | 3 |
| 15 | Travis | EWX | 24 | 10 | 0 | 0 | 0 |
| 16 | Dallam | AMA | 23 | 8 | 1 | 3 | 2 |
| 16 | Callahan | SJT | 23 | 4 | 1 | 0 | 3 |
| 18 | Gillespie | EWX | 22 | 10 | 0 | 0 | 0 |
| 18 | Hale | LUB | 22 | 3 | 0 | 1 | 4 |
| 20 | Comal | EWX | 21 | 8 | 0 | 0 | 0 |
| 20 | Floyd | LUB | 21 | 4 | 1 | 1 | 3 |
| 20 | Lamb | LUB | 21 | 3 | 0 | 1 | 3 |
| 23 | Franklin | SHV | 20 | 8 | 0 | 0 | 0 |
| 23 | Kerr | EWX | 20 | 8 | 0 | 0 | 0 |
| 23 | Haskell | SJT | 20 | 5 | 1 | 0 | 3 |
Shaded rows are Panhandle (AMA) and South Plains (LUB) zones. 12 of the top 25 are in the region.
Panhandle and South Plains Zones
Every zone served by the Amarillo and Lubbock NWS offices, with its rank among 300 Texas zones. Lower rank numbers mean more reports. Homeowners can find local help through our Amarillo roofing, Lubbock roofing and Amarillo roof repair pages.
| Zone | Region | Snow and ice (rank) | Winter storm (rank) | Ice storm (rank) | Blizzard (rank) | Reported damage |
|---|---|---|---|---|---|---|
| Parmer | South Plains | 30 (#3) | 3 (#98) | 1 (#64) | 2 (#3) | $8.0 million |
| Castro | South Plains | 30 (#3) | 3 (#98) | 1 (#64) | 2 (#3) | $4.0 million |
| Hall | South Plains | 28 (#5) | 6 (#31) | 1 (#64) | 0 (#46) | $20,000 |
| Motley | South Plains | 28 (#5) | 5 (#46) | 2 (#17) | 0 (#46) | $420,000 |
| Swisher | South Plains | 28 (#5) | 3 (#98) | 1 (#64) | 1 (#10) | $225,000 |
| Childress | South Plains | 26 (#9) | 5 (#46) | 2 (#17) | 0 (#46) | $50,000 |
| Lubbock | South Plains | 26 (#9) | 4 (#71) | 2 (#17) | 1 (#10) | $13.6 million |
| Bailey | South Plains | 26 (#9) | 3 (#98) | 0 (#159) | 1 (#10) | $6.0 million |
| Dallam | Panhandle | 23 (#16) | 8 (#11) | 1 (#64) | 3 (#1) | $0 |
| Hale | South Plains | 22 (#18) | 3 (#98) | 0 (#159) | 1 (#10) | $200,000 |
| Floyd | South Plains | 21 (#20) | 4 (#71) | 1 (#64) | 1 (#10) | $35,000 |
| Lamb | South Plains | 21 (#20) | 3 (#98) | 0 (#159) | 1 (#10) | $1.0 million |
| Briscoe | South Plains | 20 (#23) | 4 (#71) | 1 (#64) | 1 (#10) | $50,000 |
| Hockley | South Plains | 20 (#23) | 4 (#71) | 0 (#159) | 1 (#10) | $600,000 |
| Cottle | South Plains | 20 (#23) | 3 (#98) | 2 (#17) | 0 (#46) | $350,000 |
| Randall | Panhandle | 19 (#31) | 9 (#6) | 1 (#64) | 1 (#10) | $0 |
| Hartley | Panhandle | 19 (#31) | 6 (#31) | 1 (#64) | 3 (#1) | $0 |
| Oldham | Panhandle | 18 (#40) | 7 (#21) | 1 (#64) | 2 (#3) | $1,000 |
| Potter | Panhandle | 18 (#40) | 7 (#21) | 1 (#64) | 1 (#10) | $10,000 |
| Gray | Panhandle | 18 (#40) | 7 (#21) | 1 (#64) | 1 (#10) | $20,000 |
| Wheeler | Panhandle | 18 (#40) | 7 (#21) | 2 (#17) | 1 (#10) | $188,000 |
| Sherman | Panhandle | 18 (#40) | 5 (#46) | 1 (#64) | 2 (#3) | $0 |
| Hutchinson | Panhandle | 18 (#40) | 5 (#46) | 2 (#17) | 1 (#10) | $1.2 million |
| Ochiltree | Panhandle | 18 (#40) | 4 (#71) | 2 (#17) | 0 (#46) | $5.7 million |
| King | South Plains | 18 (#40) | 4 (#71) | 2 (#17) | 0 (#46) | $0 |
| Crosby | South Plains | 18 (#40) | 3 (#98) | 1 (#64) | 1 (#10) | $650,000 |
| Dickens | South Plains | 18 (#40) | 2 (#129) | 4 (#1) | 0 (#46) | $157,000 |
| Deaf Smith | Panhandle | 17 (#56) | 7 (#21) | 1 (#64) | 2 (#3) | $0 |
| Lipscomb | Panhandle | 17 (#56) | 5 (#46) | 2 (#17) | 1 (#10) | $2.2 million |
| Moore | Panhandle | 17 (#56) | 5 (#46) | 1 (#64) | 2 (#3) | $34,000 |
| Roberts | Panhandle | 17 (#56) | 5 (#46) | 2 (#17) | 1 (#10) | $0 |
| Carson | Panhandle | 17 (#56) | 5 (#46) | 2 (#17) | 2 (#3) | $20,000 |
| Lynn | South Plains | 17 (#56) | 5 (#46) | 1 (#64) | 1 (#10) | $400,000 |
| Stonewall | South Plains | 17 (#56) | 4 (#71) | 3 (#5) | 0 (#46) | $0 |
| Armstrong | Panhandle | 16 (#70) | 7 (#21) | 1 (#64) | 1 (#10) | $0 |
| Garza | South Plains | 16 (#70) | 5 (#46) | 2 (#17) | 1 (#10) | $40,000 |
| Hansford | Panhandle | 16 (#70) | 4 (#71) | 2 (#17) | 0 (#46) | $2.8 million |
| Yoakum | South Plains | 16 (#70) | 3 (#98) | 0 (#159) | 1 (#10) | $35,000 |
| Cochran | South Plains | 15 (#77) | 3 (#98) | 0 (#159) | 1 (#10) | $150,000 |
| Terry | South Plains | 15 (#77) | 3 (#98) | 0 (#159) | 1 (#10) | $250,000 |
| Hemphill | Panhandle | 14 (#85) | 4 (#71) | 2 (#17) | 1 (#10) | $2.3 million |
| Collingsworth | Panhandle | 14 (#85) | 4 (#71) | 1 (#64) | 1 (#10) | $0 |
| Kent | South Plains | 14 (#85) | 4 (#71) | 2 (#17) | 0 (#46) | $0 |
| Donley | Panhandle | 12 (#103) | 6 (#31) | 2 (#17) | 1 (#10) | $0 |
| Palo Duro Canyon | Panhandle | 2 (#236) | 1 (#171) | 0 (#159) | 0 (#46) | $0 |
State Ranking: Winter Storm and Ice Storm Reports
All 50 states, ranked by combined Winter Storm and Ice Storm reports, 2015 through 2025. Wyoming leads on that measure with 2,212. Texas ranks #13 on the combined count but #1 for ice storms alone and #1 for reported winter and cold property damage.
| # | State | Winter storm + ice | Ice storm (rank) | Blizzard | Per 1,000 sq mi | Reported damage (rank) |
|---|---|---|---|---|---|---|
| 1 | Wyoming | 2,212 | 0 (#44) | 133 | 22.8 | $215,000 (#43) |
| 2 | Minnesota | 1,742 | 47 (#23) | 857 | 21.9 | $20.5 million (#11) |
| 3 | Iowa | 1,679 | 136 (#4) | 593 | 30.1 | $3.6 million (#32) |
| 4 | Michigan | 1,603 | 117 (#7) | 128 | 28.3 | $118.1 million (#4) |
| 5 | Montana | 1,526 | 24 (#27) | 195 | 10.5 | $13.4 million (#15) |
| 6 | Colorado | 1,503 | 6 (#34) | 109 | 14.5 | $973,500 (#37) |
| 7 | Virginia | 1,452 | 86 (#10) | 21 | 36.8 | $5.3 million (#27) |
| 8 | Wisconsin | 1,391 | 53 (#19) | 40 | 25.7 | $5.3 million (#29) |
| 9 | New York | 1,279 | 51 (#21) | 103 | 27.1 | $22.5 million (#10) |
| 10 | South Dakota | 1,235 | 78 (#12) | 841 | 16.3 | $14.8 million (#13) |
| 11 | Nebraska | 1,223 | 68 (#15) | 529 | 15.9 | $11.0 million (#18) |
| 12 | Kentucky | 1,060 | 193 (#2) | 1 | 26.8 | $3.8 million (#31) |
| 13 | Texas | 1,032 | 241 (#1) | 56 | 4.0 | $416.3 million (#1) |
| 14 | Pennsylvania | 940 | 59 (#17) | 18 | 21.0 | $5.5 million (#26) |
| 15 | Missouri | 882 | 128 (#5) | 53 | 12.8 | $5.3 million (#28) |
| 16 | Illinois | 829 | 102 (#8) | 38 | 14.9 | $8.7 million (#19) |
| 17 | North Carolina | 816 | 73 (#14) | 4 | 16.8 | $11.2 million (#17) |
| 18 | Ohio | 777 | 47 (#23) | 7 | 19.0 | $23.0 million (#9) |
| 19 | Arkansas | 722 | 95 (#9) | 0 | 13.9 | $4.6 million (#30) |
| 20 | Tennessee | 712 | 76 (#13) | 1 | 17.3 | $78.9 million (#7) |
| 21 | West Virginia | 673 | 56 (#18) | 17 | 28.0 | $7.8 million (#21) |
| 22 | Maine | 672 | 0 (#44) | 101 | 21.8 | $0 (#47) |
| 23 | Kansas | 668 | 149 (#3) | 278 | 8.2 | $7.5 million (#23) |
| 24 | Vermont | 651 | 5 (#35) | 4 | 70.6 | $7.8 million (#22) |
| 25 | Indiana | 629 | 63 (#16) | 12 | 17.6 | $5.9 million (#24) |
| 26 | California | 499 | 5 (#35) | 21 | 3.2 | $18.0 million (#12) |
| 27 | Idaho | 497 | 5 (#35) | 13 | 6.0 | $103.6 million (#5) |
| 28 | Maryland | 456 | 37 (#26) | 15 | 47.0 | $219,000 (#42) |
| 29 | Oklahoma | 450 | 127 (#6) | 7 | 6.6 | $98.1 million (#6) |
| 30 | Georgia | 419 | 23 (#28) | 0 | 7.3 | $15,000 (#46) |
| 31 | Alaska | 408 | 23 (#28) | 524 | 0.7 | $260,800 (#40) |
| 32 | New Jersey | 363 | 2 (#40) | 33 | 49.4 | $250,000 (#41) |
| 33 | Utah | 345 | 1 (#42) | 0 | 4.2 | $5.7 million (#25) |
| 34 | New Hampshire | 300 | 0 (#44) | 7 | 33.5 | $0 (#47) |
| 35 | Mississippi | 265 | 48 (#22) | 0 | 5.6 | $13.5 million (#14) |
| 36 | Oregon | 256 | 53 (#19) | 9 | 2.7 | $212.2 million (#3) |
| 37 | North Dakota | 243 | 43 (#25) | 905 | 3.5 | $69.3 million (#8) |
| 38 | Massachusetts | 232 | 5 (#35) | 37 | 29.7 | $3.1 million (#33) |
| 39 | Washington | 219 | 84 (#11) | 11 | 3.3 | $8.7 million (#20) |
| 40 | Louisiana | 142 | 17 (#32) | 4 | 3.3 | $2.0 million (#34) |
| 41 | Alabama | 140 | 20 (#30) | 0 | 2.8 | $70,000 (#44) |
| 42 | South Carolina | 139 | 20 (#30) | 0 | 4.6 | $60,000 (#45) |
| 43 | Connecticut | 117 | 4 (#39) | 21 | 24.2 | $263,700 (#39) |
| 44 | New Mexico | 110 | 9 (#33) | 50 | 0.9 | $411.7 million (#2) |
| 45 | Arizona | 77 | 1 (#42) | 0 | 0.7 | $1.4 million (#35) |
| 46 | Rhode Island | 52 | 0 (#44) | 13 | 50.3 | $271,100 (#38) |
| 47 | Delaware | 36 | 0 (#44) | 3 | 18.5 | $0 (#47) |
| 48 | Nevada | 31 | 0 (#44) | 1 | 0.3 | $13.2 million (#16) |
| 49 | Florida | 26 | 2 (#40) | 0 | 0.5 | $1.4 million (#36) |
| 50 | Hawaii | 6 | 0 (#44) | 3 | 0.9 | $0 (#47) |
What This Means for Your Roof
Panhandle snow rarely piles up the way it does in the northern Plains, so the risk is less about a roof collapsing and more about water getting in. These are general points, not a diagnosis of any one roof.
- Snow load. A foot of fresh, dry snow is light, but wet snow and ice weigh much more. Low-slope and flat roofs, carports, patio covers and older metal buildings are the most exposed. Sagging, new ceiling cracks or doors that suddenly stick after a heavy snow are worth a look.
- Ice dams. When snow melts on a warm roof and refreezes at the cold eaves, it can form a ridge of ice that backs water up under shingles. Good attic insulation and ventilation and an ice and water barrier at the eaves are the usual defenses.
- Freeze-thaw. Amarillo and Lubbock often swing above and below freezing in a single day. Water that gets into small cracks, worn sealant or hail-bruised shingles expands when it freezes, which can widen the damage over a winter.
- Blizzard winds. Blizzards pair snow with high wind. Wind can lift shingle tabs and drive fine snow through vents and gaps, which then melts in the attic.
- Hail first, leaks later. Many winter leaks start at damage left by spring hail. See our Texas Hail Study for how often hail hits the same counties.
Do not climb onto an icy roof. If you see a leak or sagging after a storm, our roof repair team in Amarillo can inspect it from the ground and with a drone.
Methodology
- Storm Events. NOAA NCEI Storm Events Database bulk "details" files for 2015 through 2025 (11 complete years). Event types used: Winter Storm, Ice Storm, Heavy Snow, Blizzard, Winter Weather, Sleet, Frost/Freeze, Extreme Cold/Wind Chill and Cold/Wind Chill. "Snow and ice" counts only the first six. Each record counts as one report.
- Zones, not counties. All 4,112 Texas winter and cold records in the period are filed by NWS forecast zone, not by county. Zones were matched by zone number. In the Panhandle and South Plains most zones share a county's name and borders. Records for Randall County filed as "Randall" and "Randall County" were combined. Palo Duro Canyon is a separate zone (spelled "Palo Doro Canyon" in NOAA's files) with few records.
- Region. "Panhandle" means the zones of the NWS Amarillo office (AMA) and "South Plains" the zones of the NWS Lubbock office (LUB), 45 zones in all.
- Storms. NWS offices file each storm as an "episode." Amarillo and Lubbock episodes with overlapping dates were merged into one storm for the storm table.
- Snowfall. NOAA GHCN-Daily records for Amarillo (USW00023047) and Lubbock (USW00023042), converted from millimeters to inches. Values with a quality flag were dropped. Each study season had no missing days. Seasons run July 1 to June 30.
- States. State totals add up every zone report in the state. Per-area figures use 2024 Census Gazetteer land area.
- Damage. DAMAGE_PROPERTY values were summed as reported. Most winter records list no damage, and a few large statewide events carry most of the total, so these figures are incomplete and are not insured losses.
- Caveats. One storm creates a report in every zone it touches, so states and regions with more or smaller zones log more reports. Zone counts measure how often a place was included in a winter event, not how severe it was. Snowfall is measured at one airport station per city and can differ across town. Records are as published by NOAA when downloaded in October 2026 and may be revised.
Free to Use
Free to use with credit and a link to CRS Roofing & Construction. Please cite "CRS Roofing & Construction analysis of NOAA data" and link to https://crsroofer.com/texas-panhandle-winter-storm-study.
Winter Storm Study FAQ
How much snow does Amarillo get in a year?
Amarillo (NWS station USW00023047) averaged 12.4 inches of snow per season over the 10 seasons from 2015-16 through 2024-25. The 1991 to 2020 average from the same station is 17.7 inches. Seasons swing widely: 2020-21 brought 33.8 inches, while 2017-18 had no measurable snow.
How much snow does Lubbock get in a year?
Lubbock (station USW00023042) averaged 5.4 inches per season from 2015-16 through 2024-25, compared with 7.1 inches for 1991 to 2020.
When does Amarillo usually get its first snow?
The median date of the first measurable snow (0.1 inch or more) in Amarillo was December 9 for the 2015-16 through 2024-25 seasons and November 24 for 1991 to 2020. The earliest first snow in the study seasons was October 24, 2019. In Lubbock the median first measurable snow was January 1 in the study seasons and December 3 for 1991 to 2020.
What was the biggest snowstorm in Amarillo and Lubbock?
In the 2015 to 2025 data, Amarillo's biggest single snow day was 11 inches on January 21, 2015, and Lubbock's was 11 inches on December 27, 2015, during a storm NOAA classified as a blizzard in 33 Panhandle and South Plains zones. Amarillo's biggest snow day in the full station record is 19 inches on February 25, 2013.
Does Texas get ice storms?
Yes. Texas logged 241 Ice Storm reports in the NOAA Storm Events Database from 2015 through 2025, the most of any state. Texas has many forecast zones, so part of that lead reflects its size. In the Panhandle and South Plains, 7 separate storms produced ice storm reports over the 11 years.
Can snow and ice damage a roof in the Texas Panhandle?
Yes, though the Panhandle sees less snow load than northern states. The common problems are ice dams at the eaves after a snow sits and melts, freeze-thaw cycles that open small cracks and loosen flashing sealant, and wind-driven snow during blizzards getting under lifted shingles or through vents. A roof that already has hail or wind damage is more likely to leak in a winter storm.
Can I use this data in a story?
Yes. The tables and charts are free to use with credit and a link to CRS Roofing & Construction at https://crsroofer.com/texas-panhandle-winter-storm-study.
Media kit: download graphics
Maps, charts and square stat cards sized for TV (1920x1080) and social (1080x1080), in PNG and SVG. Free to use with credit to CRS Roofing & Construction.