Texas Hail Study: Where Hail Hits Hardest (2015 to 2025)
A CRS Roofing & Construction data study. Source: NOAA NCEI Storm Events Database, 2015 through 2025.
Headline finding
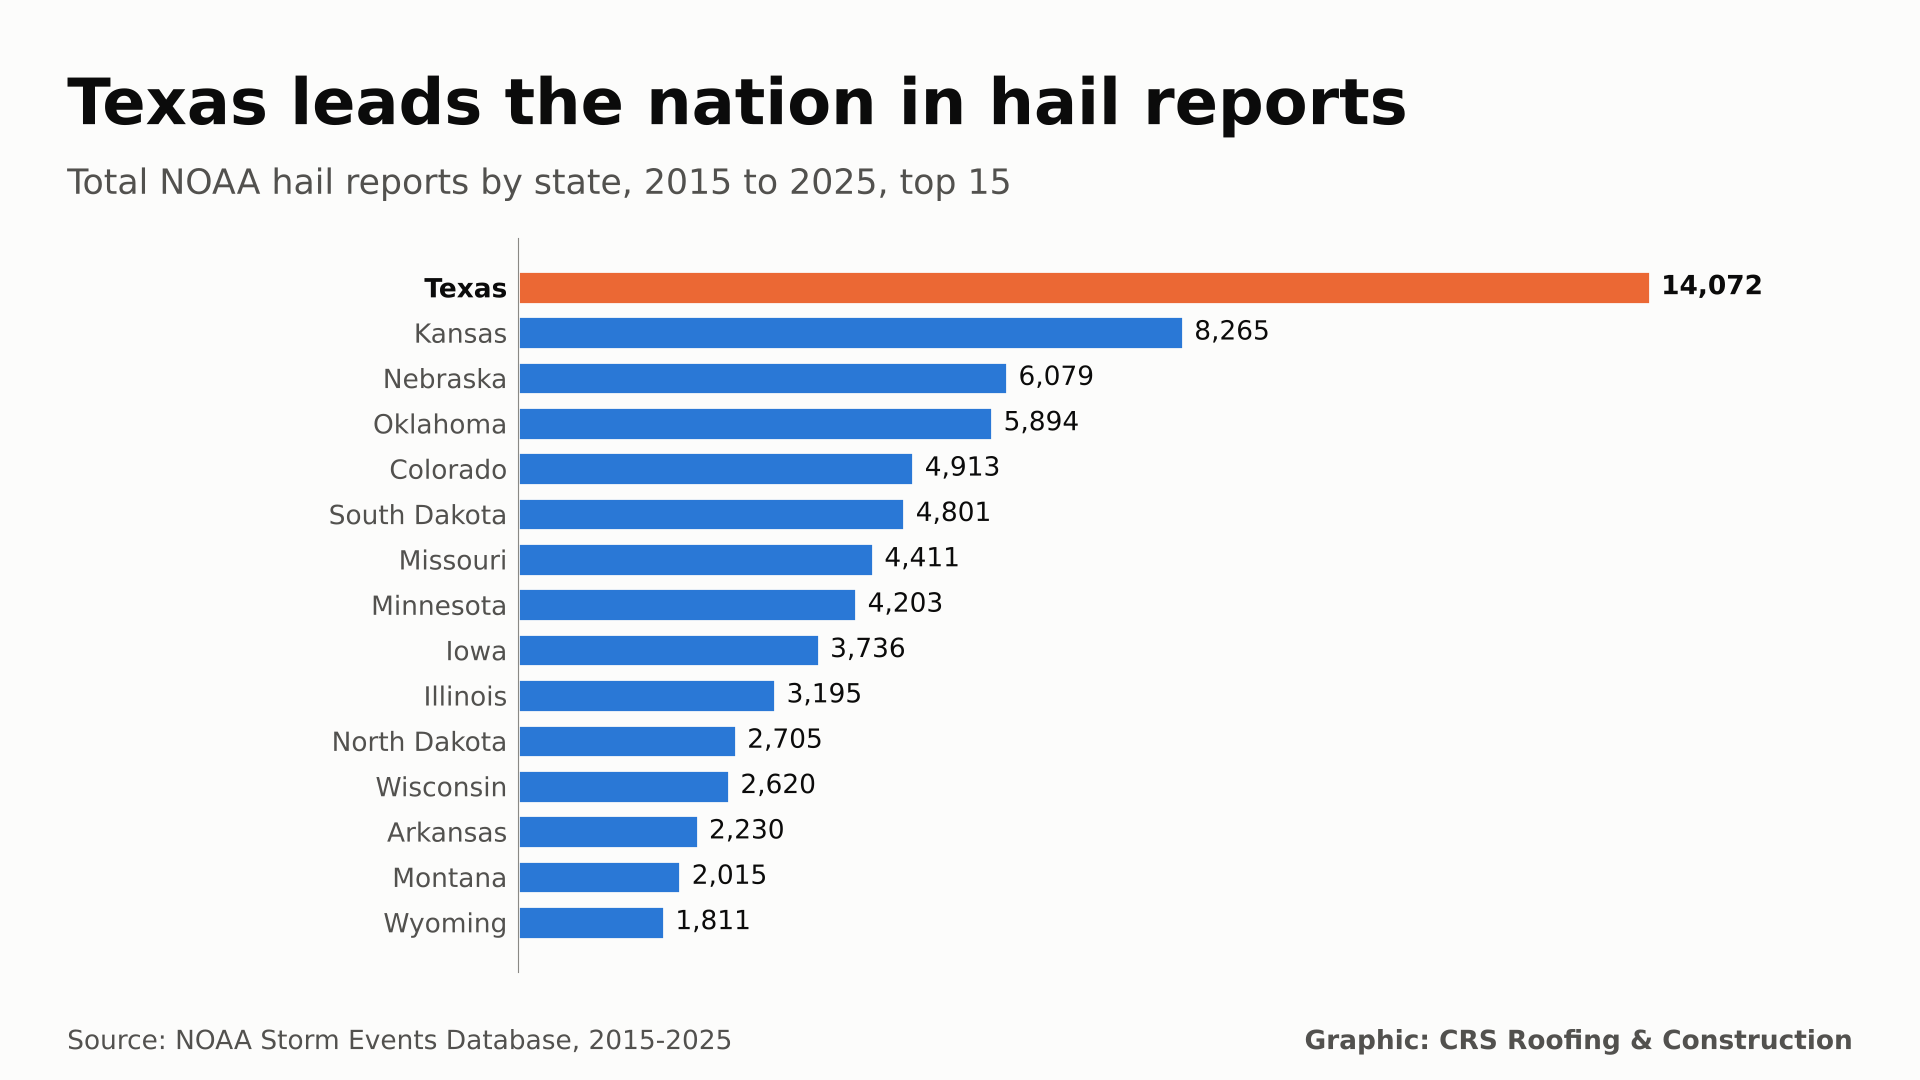
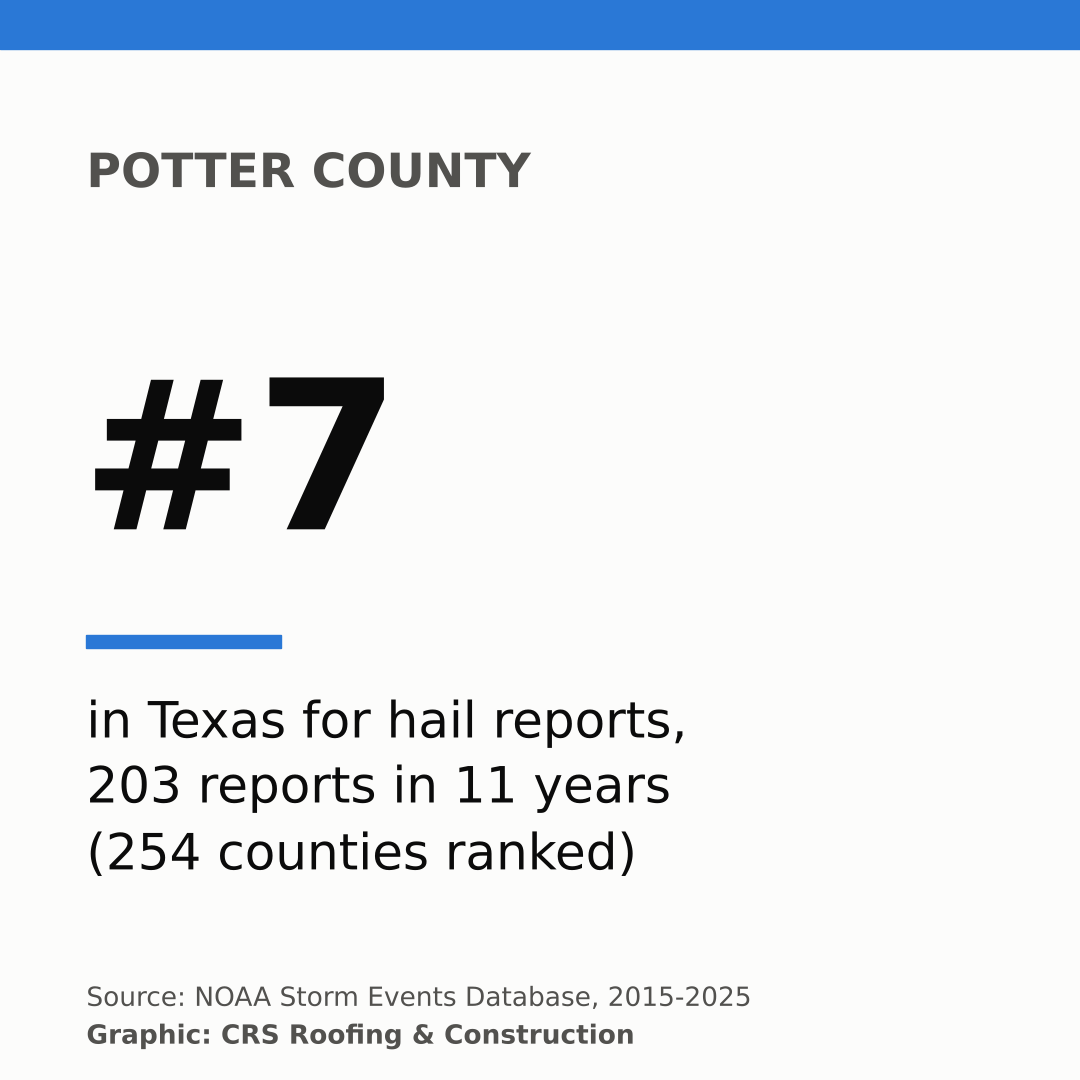
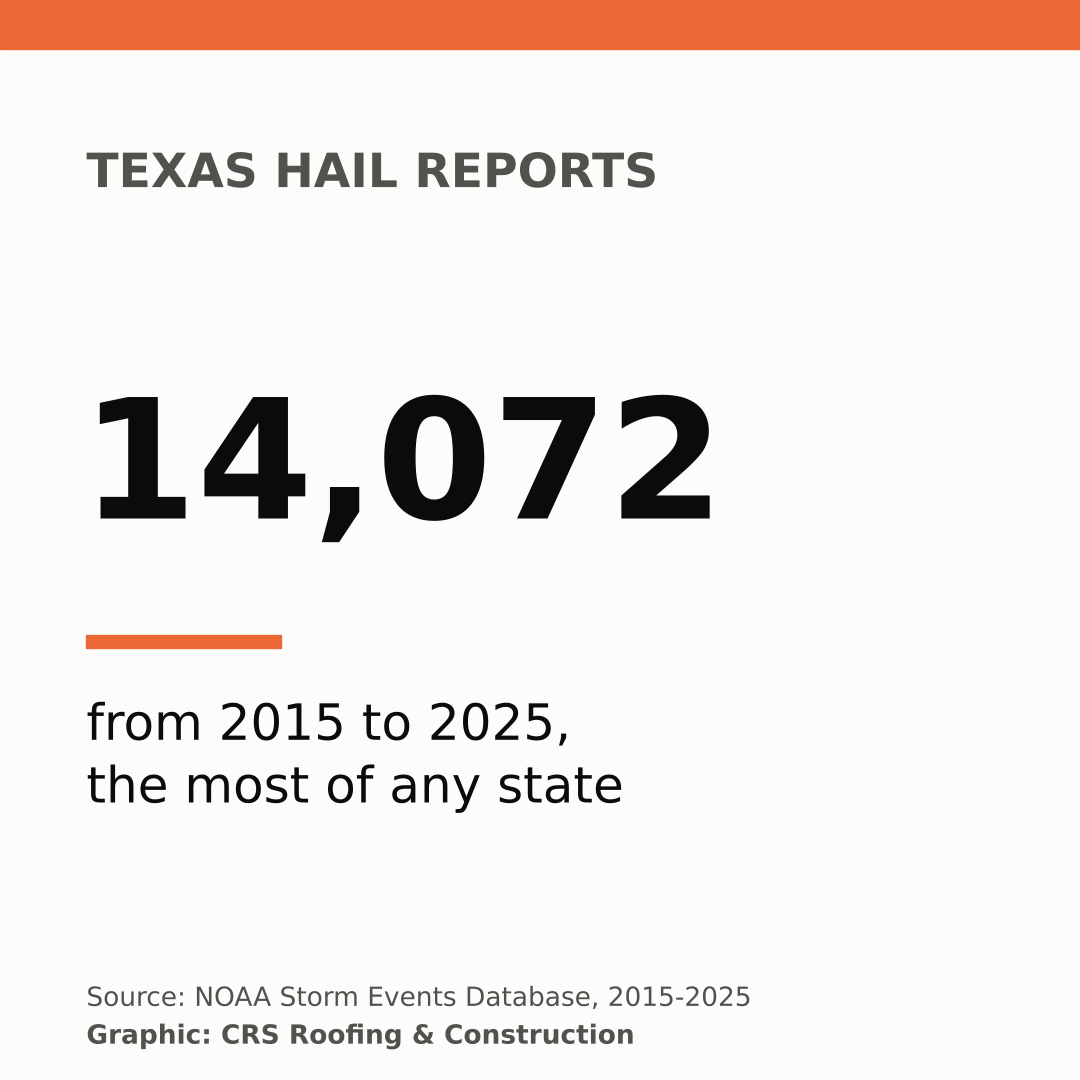
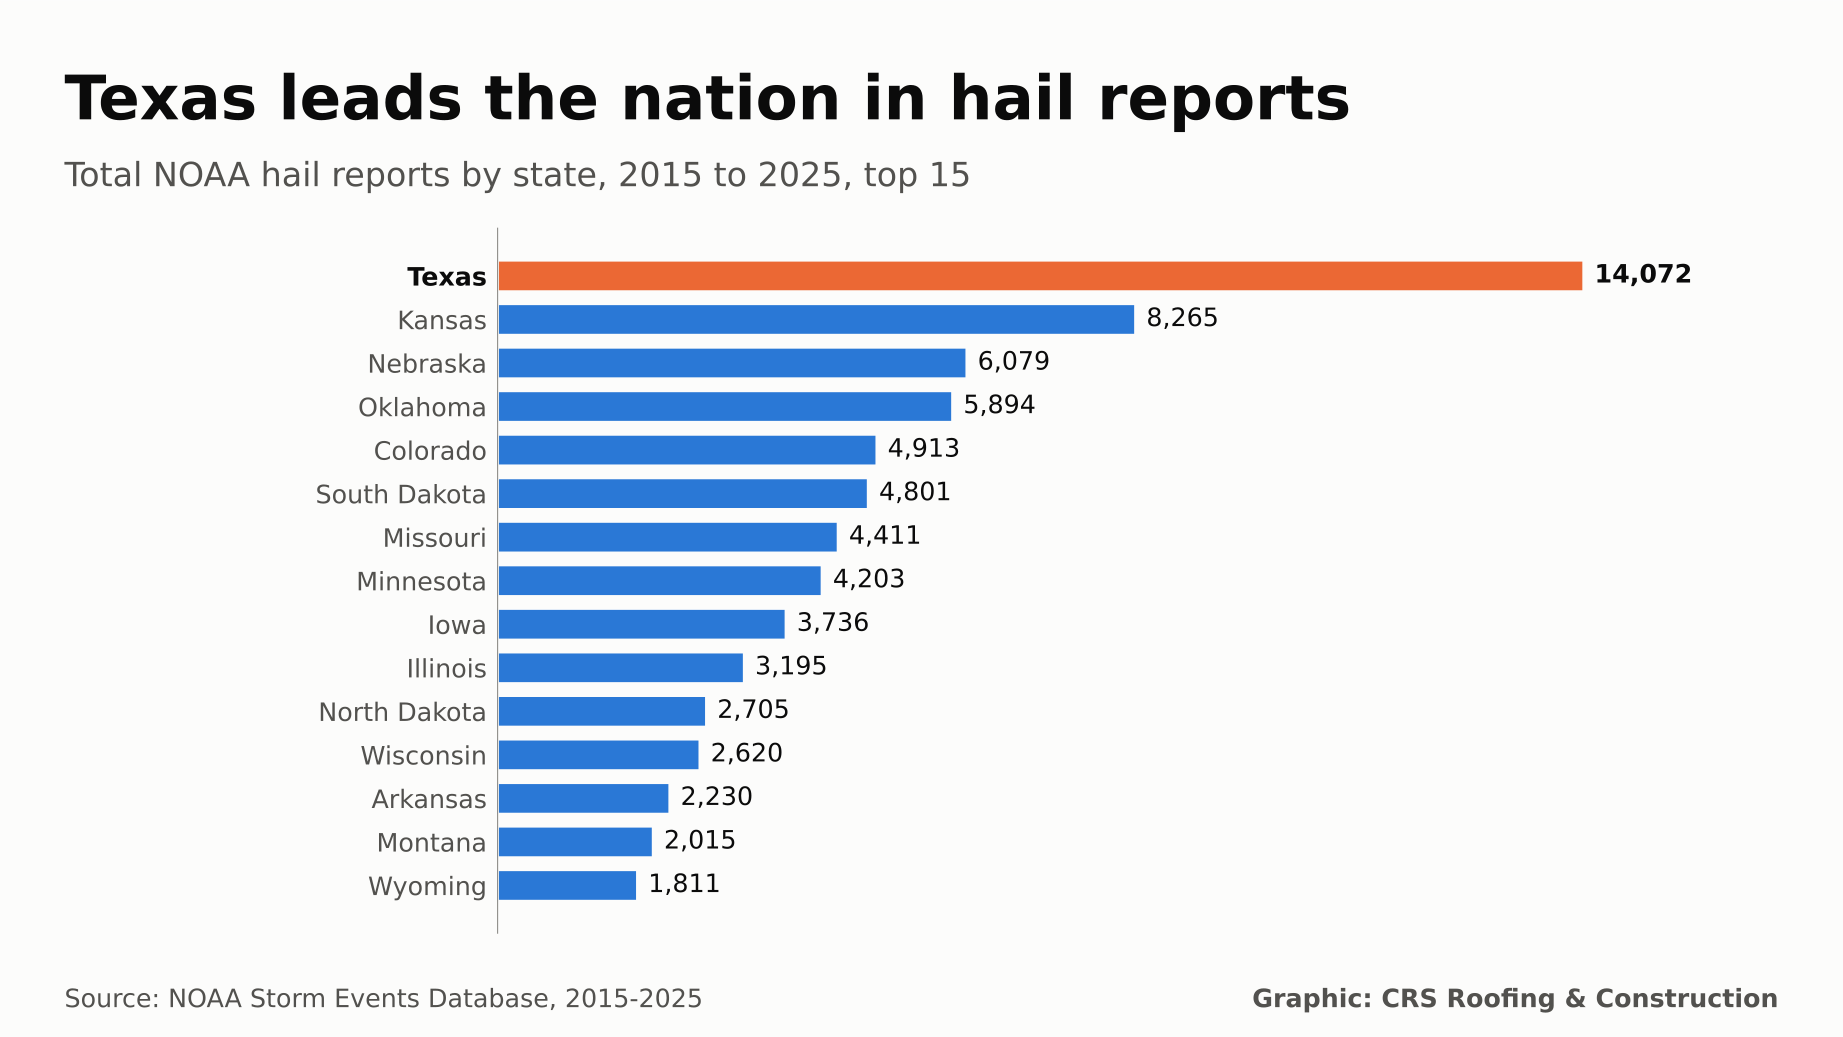
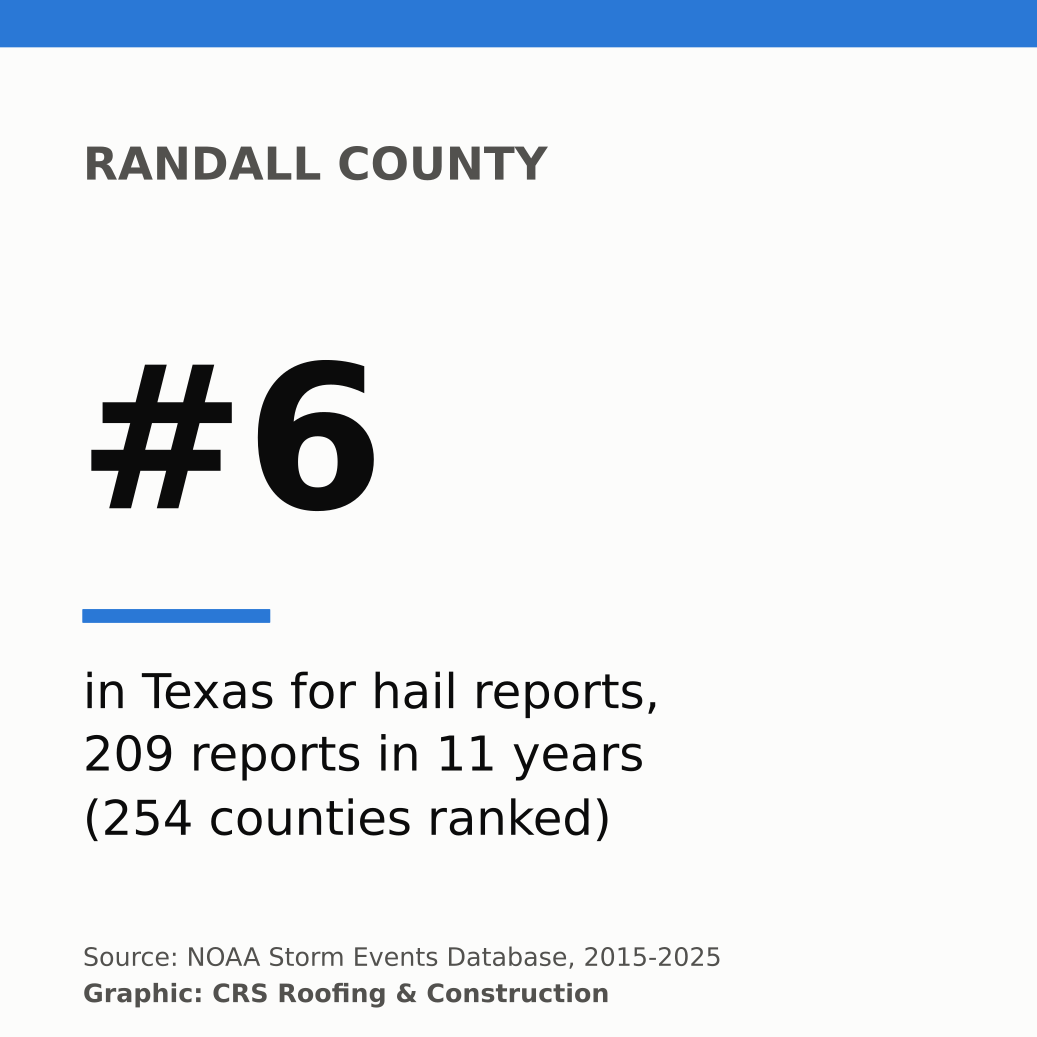
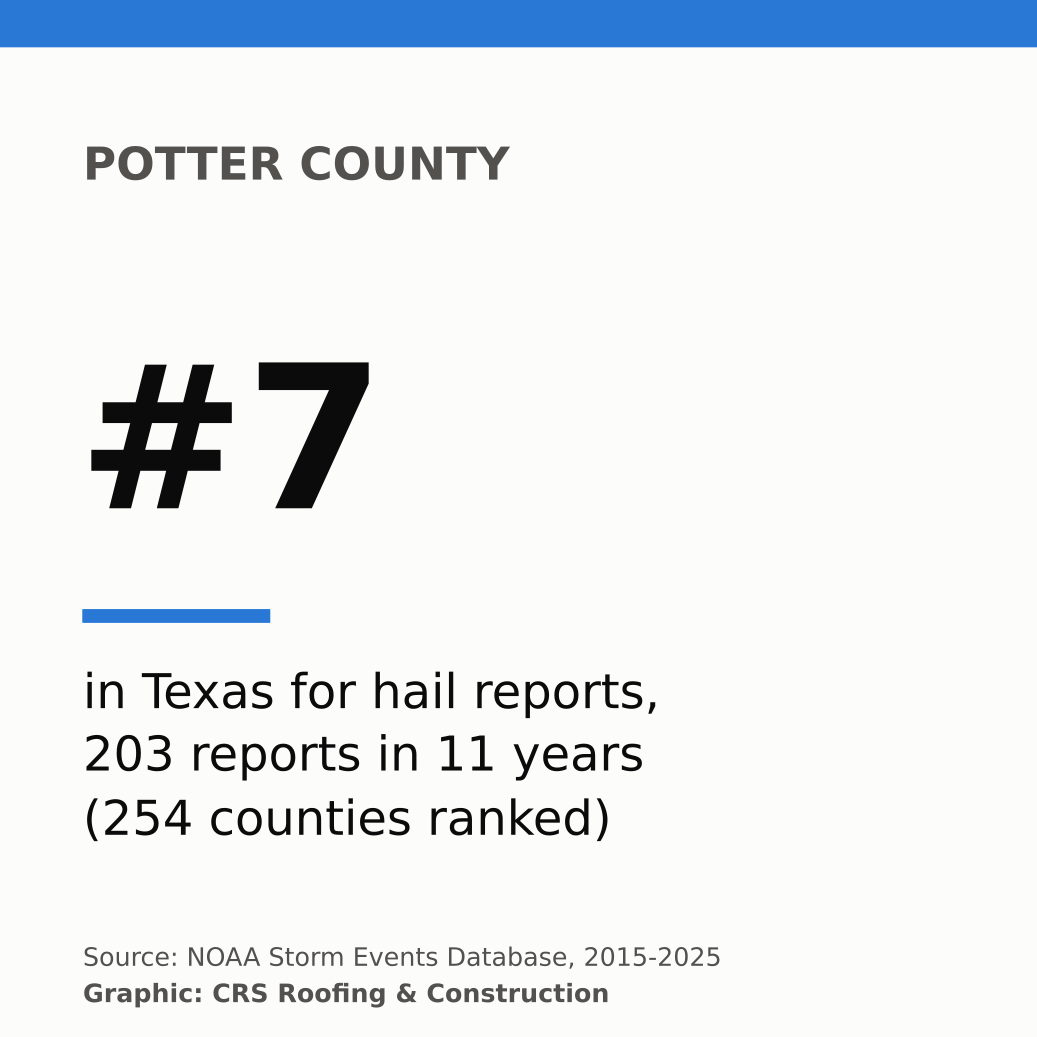
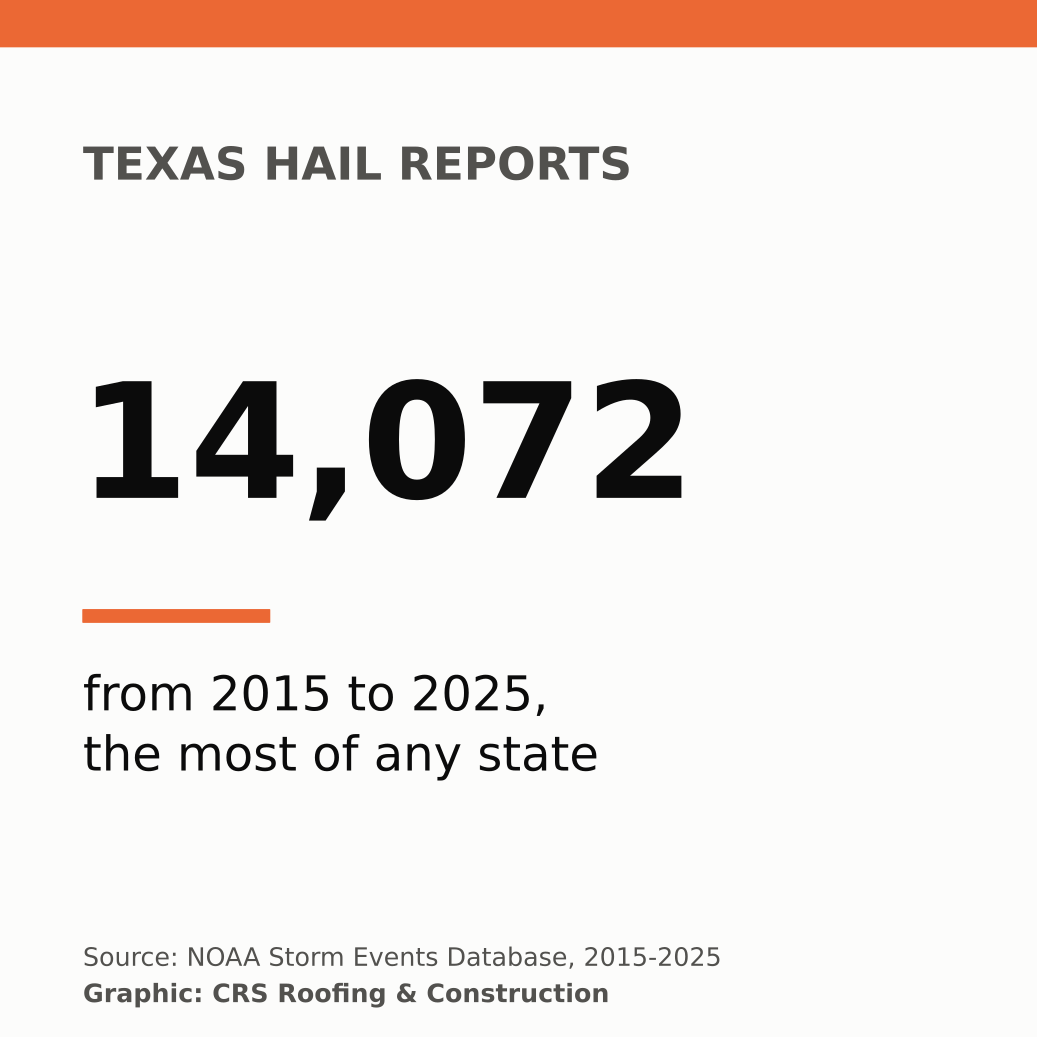
Texas logged 14,072 hail reports from 2015 through 2025, more than any other state. Amarillo's two counties, Randall (#6) and Potter (#7), rank in the top 10 of all 254 Texas counties, with 412 reports combined.
14,072
Texas hail reports, 2015 to 2025 (#1 of 50 states)
2,137
Texas reports of hail 2 inches or larger
43%
Share of Amarillo-area hail reports that came in May
7.02 in
Largest Texas hailstone in the data: Swisher County, June 2, 2024
Key Findings
- Texas leads the nation in raw hail reports. 14,072 reports in 11 years, or 1279.3 per year. Adjusted for its size, Texas ranks #8 at 4.9 reports per 1,000 square miles per year. Kansas ranks #1 at 9.19.
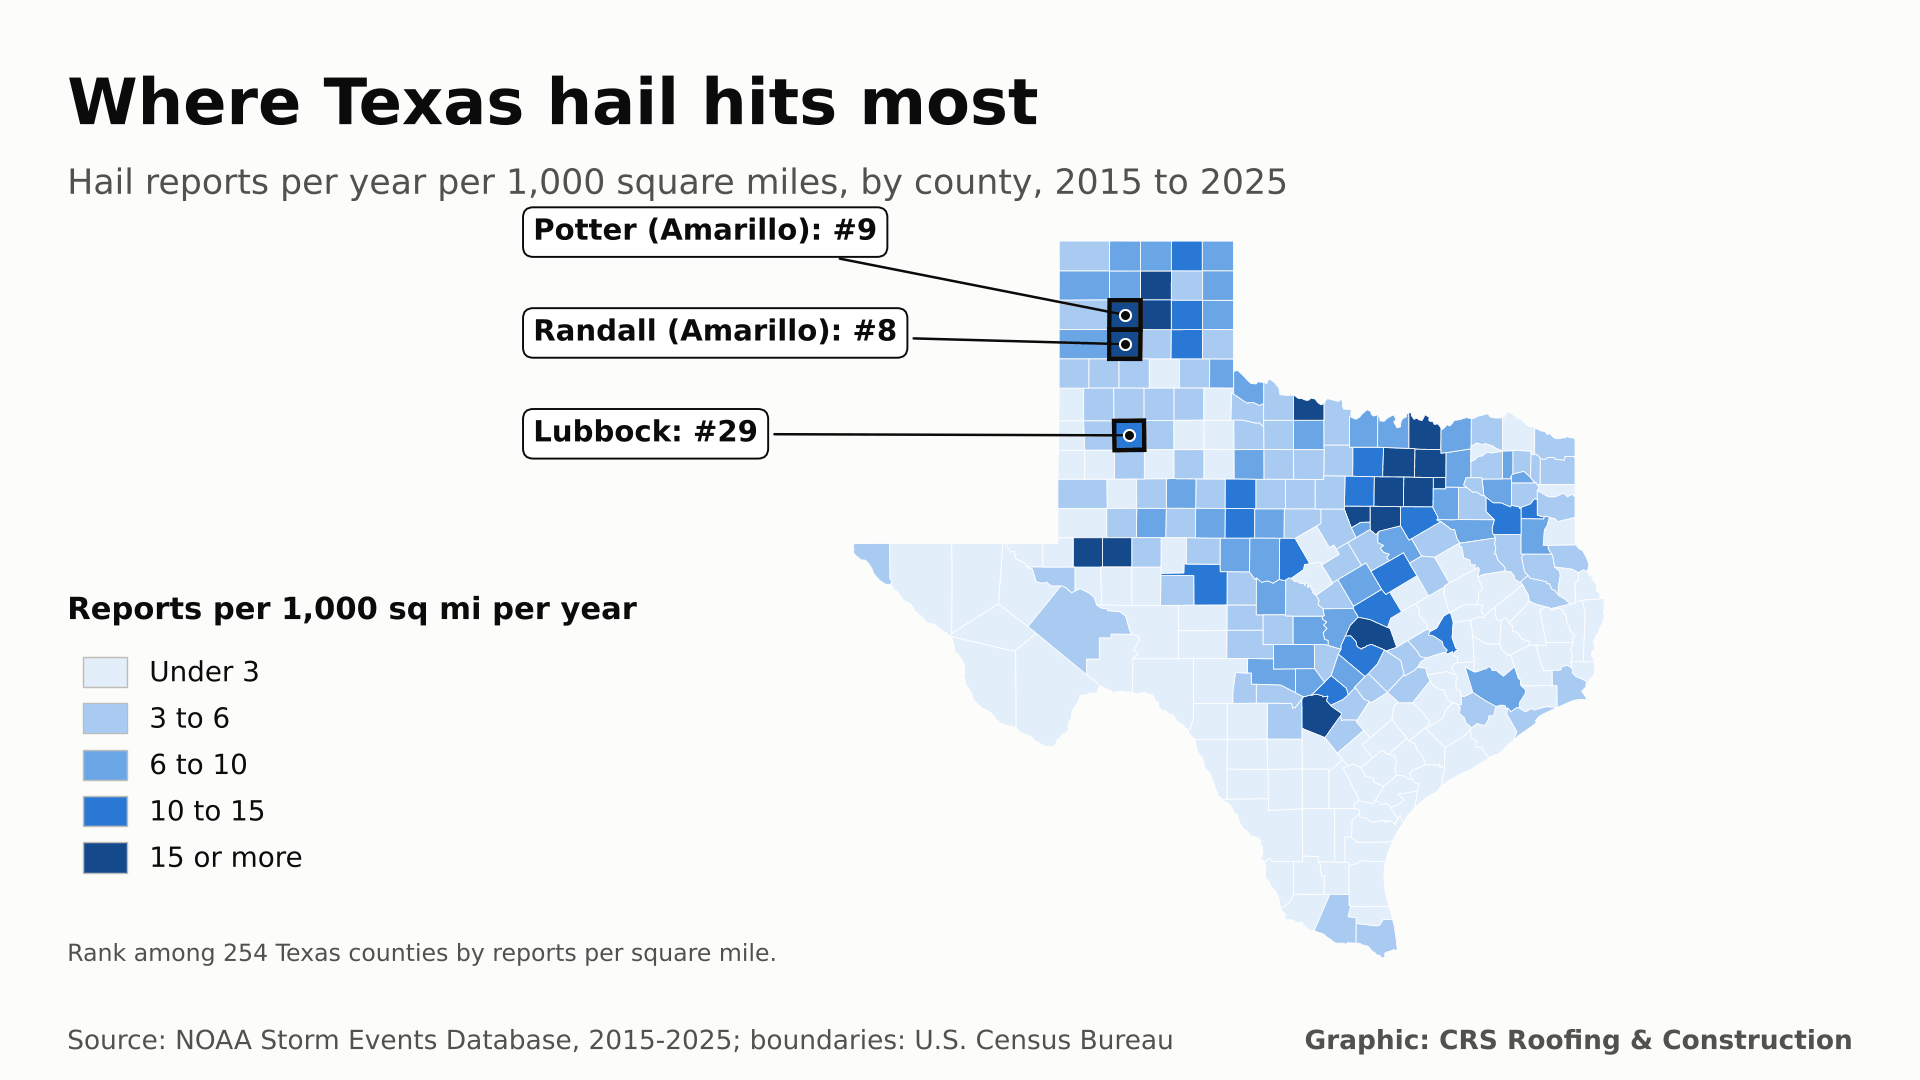
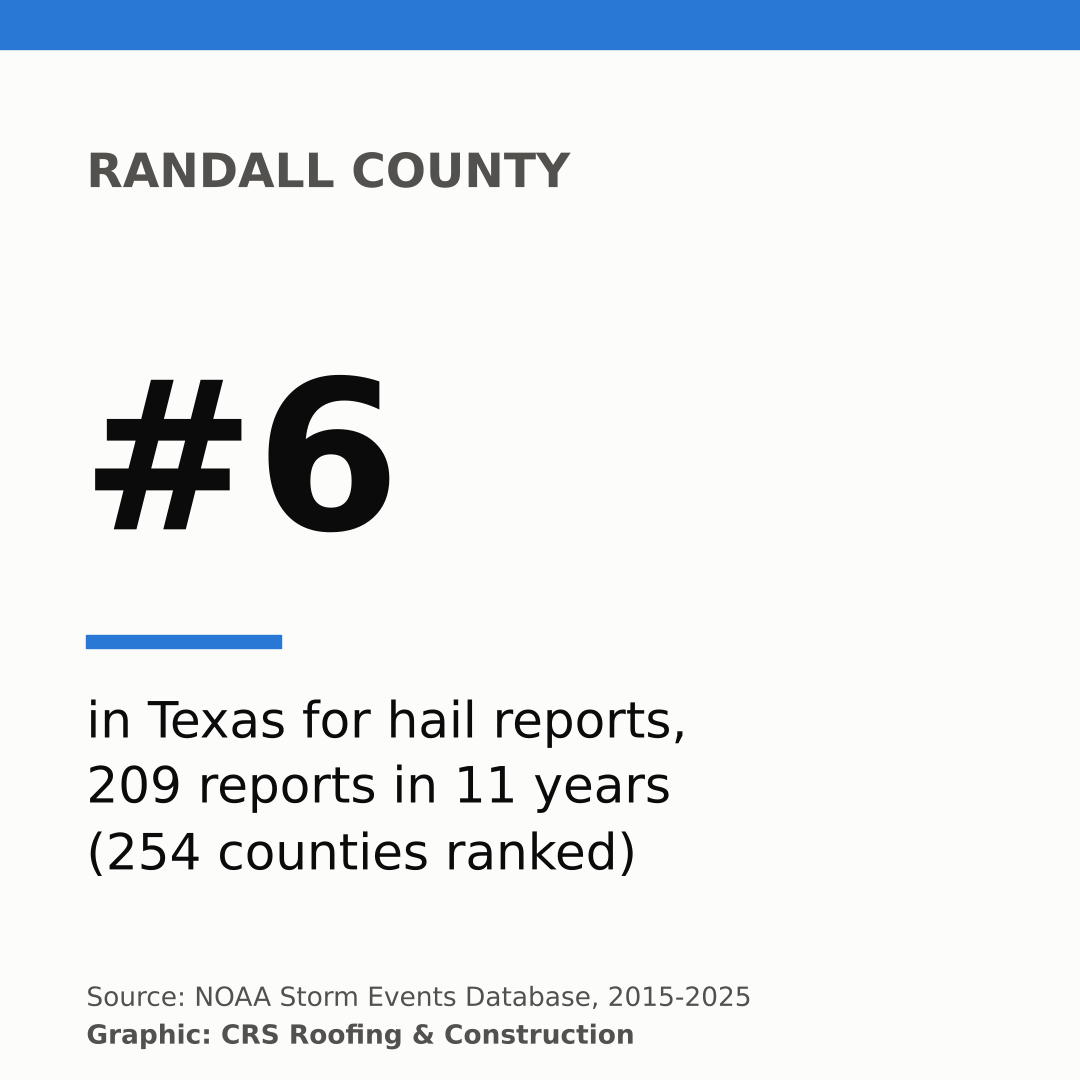
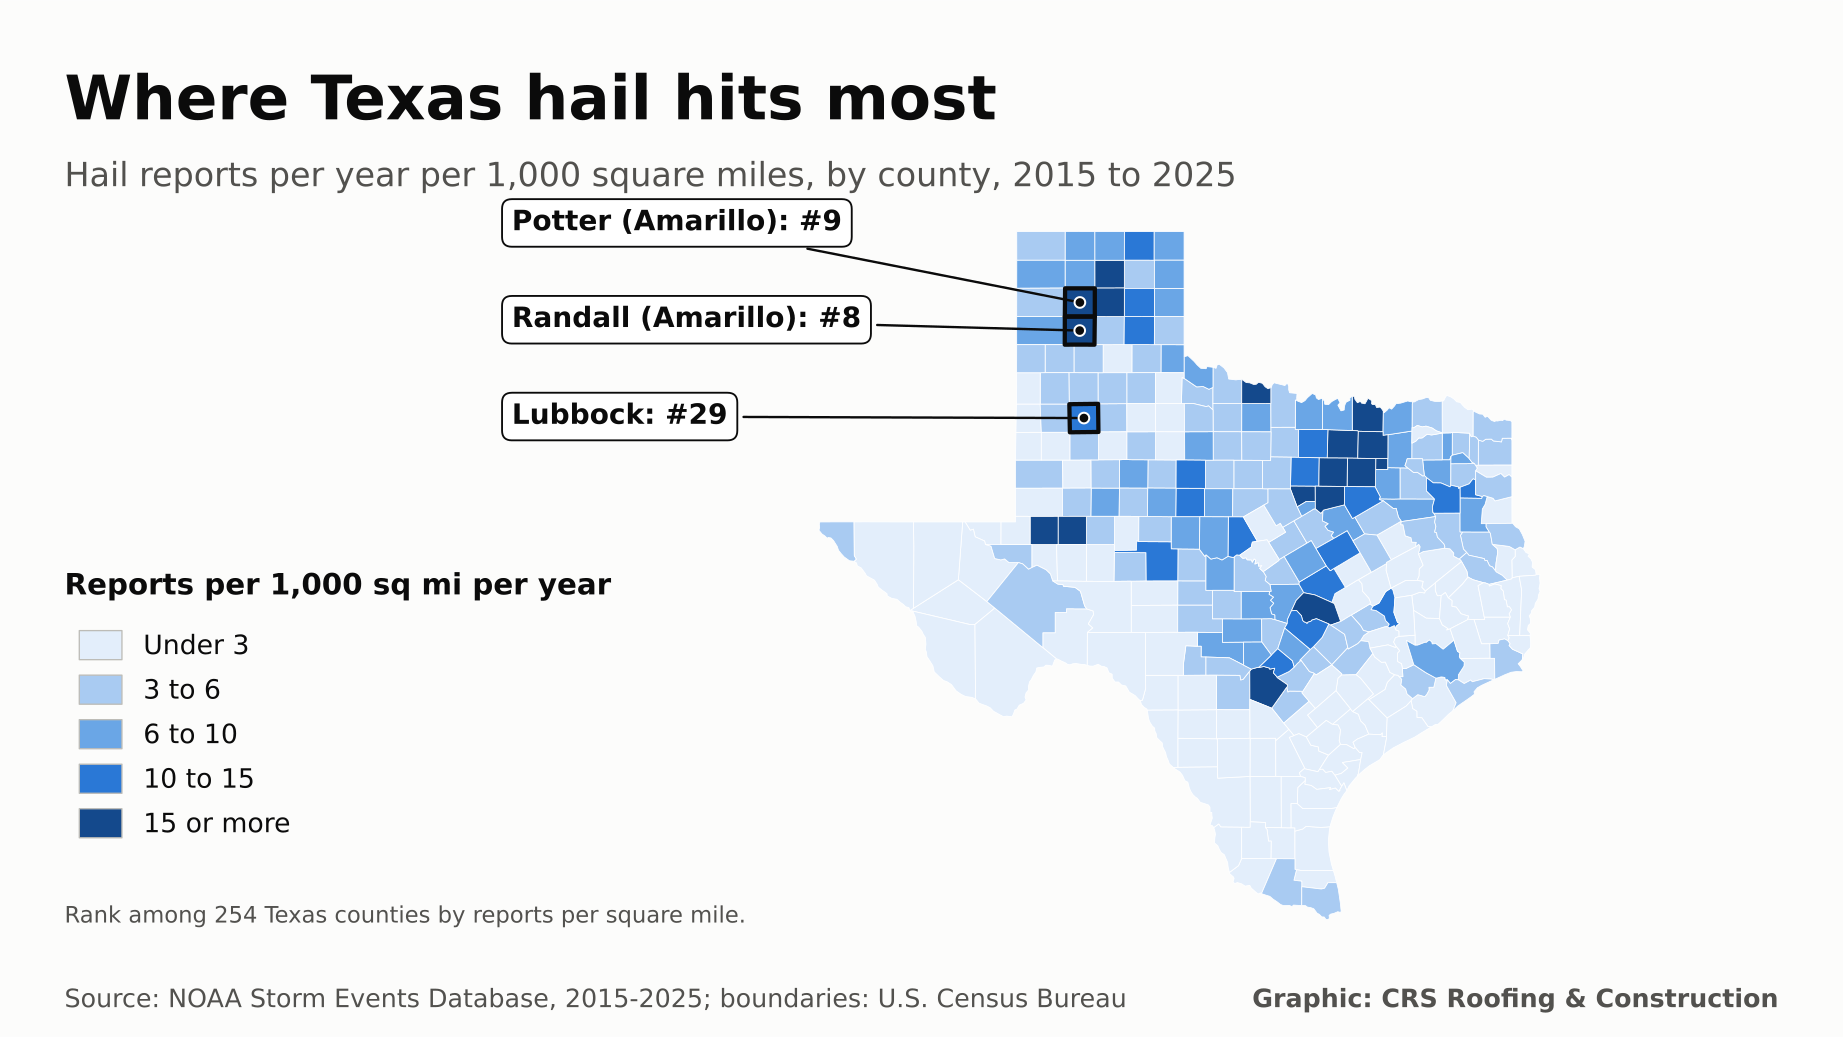
- Amarillo is a top 10 Texas hail county twice over. Randall County logged 209 reports (#6) and Potter County 203 (#7). Per square mile they rank #8 and #9. Every county above them except Pecos is part of the Dallas-Fort Worth or San Antonio metros.
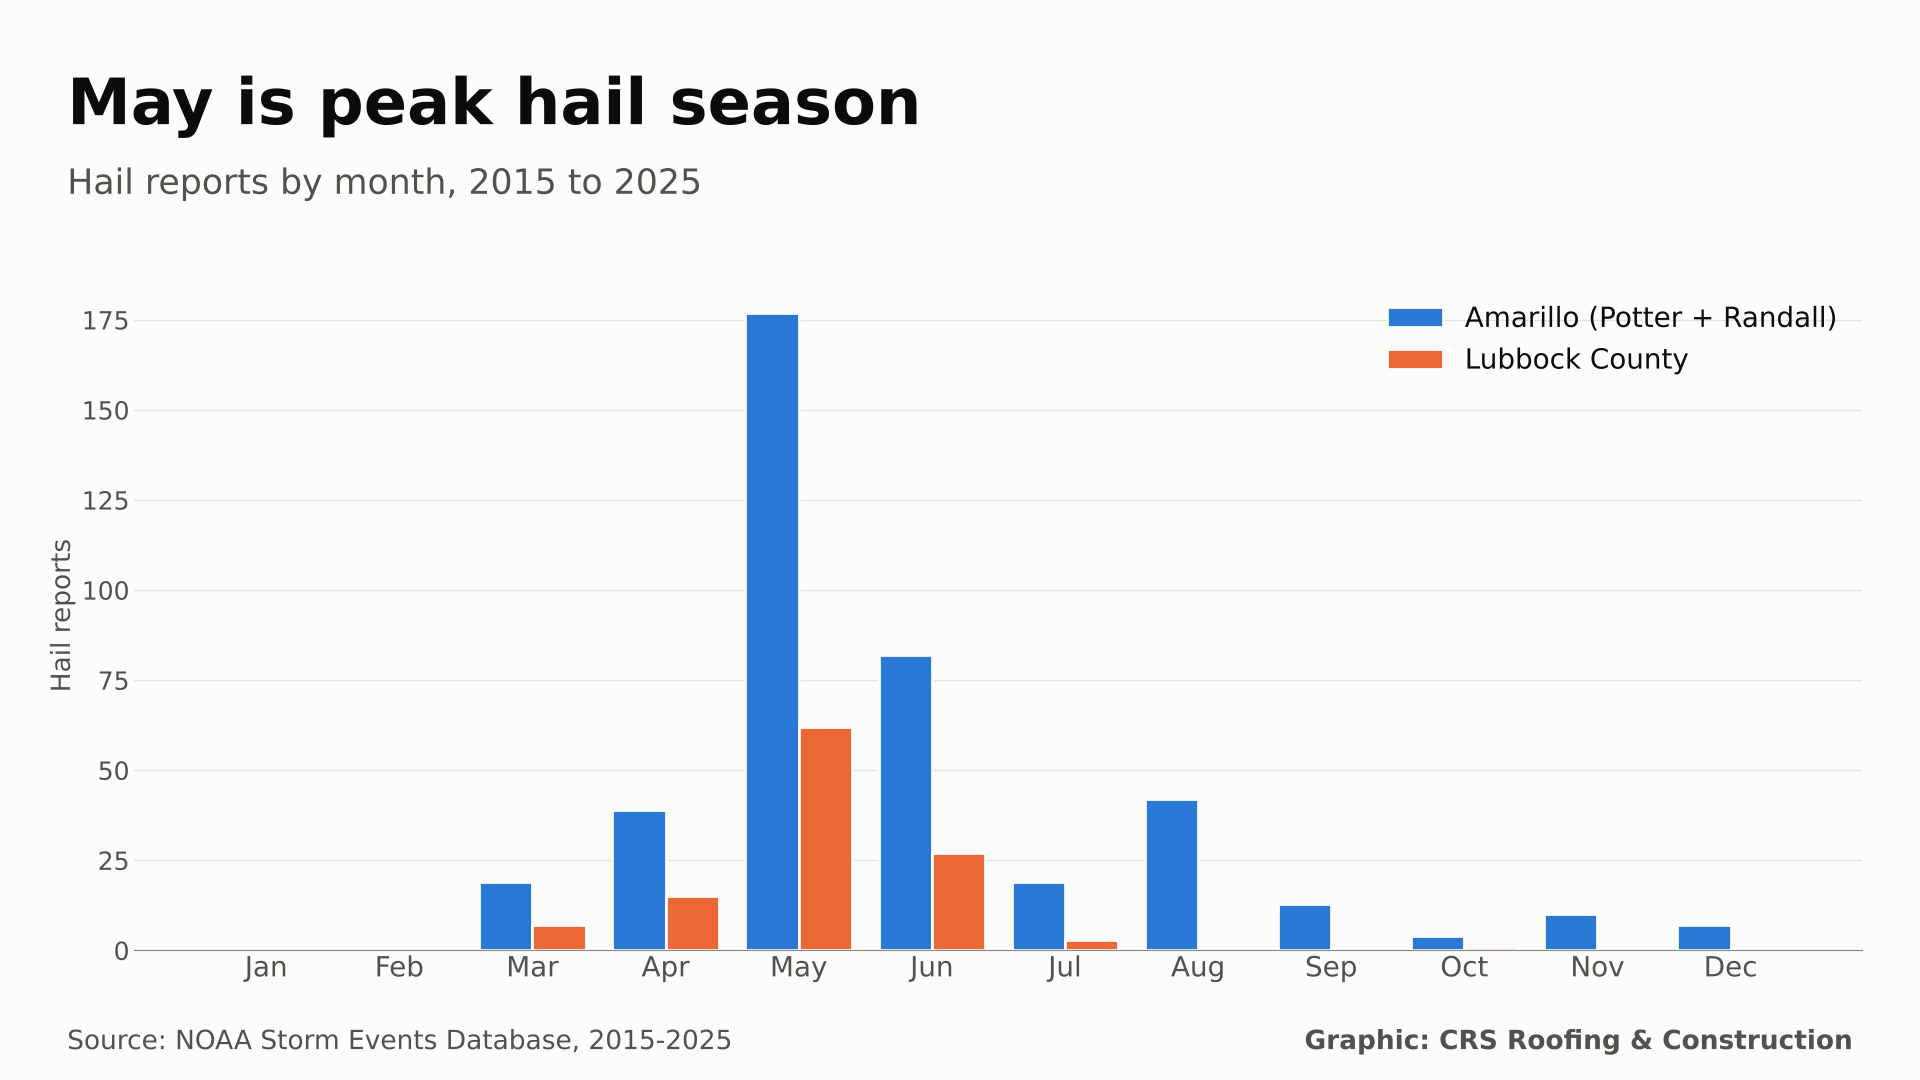
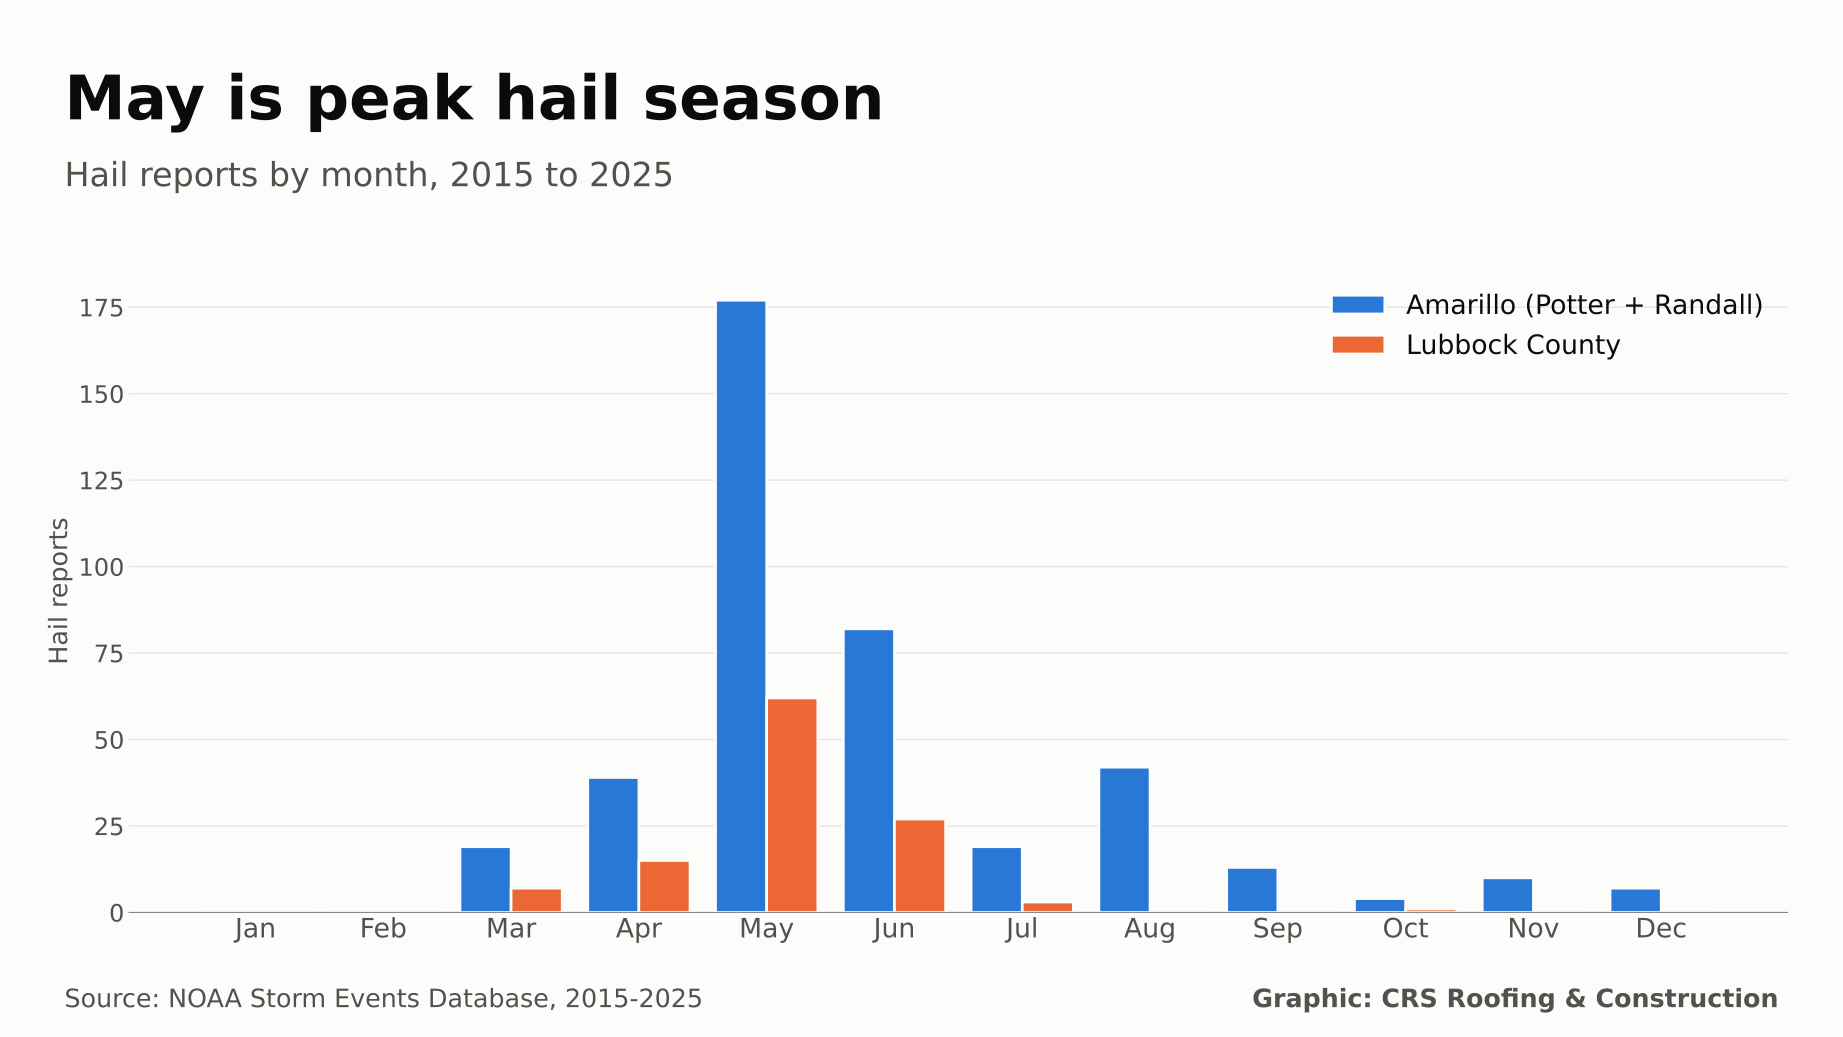
- May owns hail season. 177 of 412 Potter and Randall reports (43%) and 62 of 115 Lubbock County reports (54%) began in May.
- The biggest stone fell in the Panhandle. A 7.02 inch hailstone near Vigo Park in Swisher County on June 2, 2024 is the largest hail report anywhere in Texas in the 2015 to 2025 data.
- Lubbock's damage bill stands out. Lubbock County ranked #28 by report count but #4 in Texas for reported hail property damage, at $388.1 million. Statewide, NOAA records $7.35 billion in reported hail property damage. These estimates are incomplete and should be treated as a floor.
Texas Top 25 Counties by Hail Reports
Ranked by total NOAA Storm Events hail reports, 2015 through 2025. "Per 1,000 sq mi" is reports per year per 1,000 square miles of land area.
| # | County | Reports | Per year | 2 in+ | Per 1,000 sq mi | Largest (in) |
|---|---|---|---|---|---|---|
| 1 | Tarrant | 482 | 43.8 | 59 | 50.64 | 5.0 |
| 2 | Denton | 379 | 34.5 | 60 | 39.21 | 5.9 |
| 3 | Collin | 316 | 28.7 | 63 | 34.14 | 5.25 |
| 4 | Bexar | 302 | 27.5 | 53 | 22.13 | 5.5 |
| 5 | Pecos | 218 | 19.8 | 51 | 4.16 | 5.0 |
| 6 | Randall | 209 | 19.0 | 20 | 20.82 | 3.0 |
| 7 | Potter | 203 | 18.5 | 21 | 20.32 | 3.0 |
| 8 | Williamson | 203 | 18.5 | 32 | 16.54 | 4.0 |
| 9 | Dallas | 202 | 18.4 | 23 | 21.03 | 4.0 |
| 10 | Tom Green | 201 | 18.3 | 40 | 12.0 | 4.0 |
| 11 | Wichita | 191 | 17.4 | 8 | 27.67 | 5.33 |
| 12 | Grayson | 186 | 16.9 | 11 | 18.13 | 2.5 |
| 13 | Travis | 162 | 14.7 | 27 | 14.81 | 3.0 |
| 14 | Ector | 160 | 14.5 | 33 | 16.2 | 5.0 |
| 15 | Midland | 159 | 14.5 | 37 | 16.05 | 4.0 |
| 16 | Harris | 157 | 14.3 | 15 | 8.36 | 2.75 |
| 17 | Carson | 155 | 14.1 | 25 | 15.31 | 3.0 |
| 18 | Hutchinson | 153 | 13.9 | 23 | 15.67 | 3.0 |
| 19 | Parker | 148 | 13.5 | 17 | 14.89 | 3.0 |
| 20 | Ellis | 147 | 13.4 | 15 | 14.28 | 3.75 |
| 21 | Gray | 140 | 12.7 | 29 | 13.74 | 4.5 |
| 22 | Taylor | 136 | 12.4 | 19 | 13.5 | 3.0 |
| 23 | Wise | 125 | 11.4 | 20 | 12.56 | 4.5 |
| 24 | Bell | 124 | 11.3 | 12 | 10.7 | 5.68 |
| 25 | Jones | 122 | 11.1 | 17 | 11.94 | 4.0 |
Panhandle and South Plains Counties
Where the counties around Amarillo and Lubbock rank among all 254 Texas counties. Lower rank numbers mean more hail. Homeowners in these areas can find local help through our Amarillo roofing, Lubbock roofing and Amarillo hail damage repair pages.
| County | Reports | Rank | 2 in+ (rank) | Per-area rank | Reported damage | Largest (date) |
|---|---|---|---|---|---|---|
| Randall | 209 | #6 | 20 (#20) | #8 | $6.1 million | 3.0 in (2015-04-22) |
| Potter | 203 | #7 | 21 (#19) | #9 | $18.0 million | 3.0 in (2016-05-16) |
| Carson | 155 | #17 | 25 (#14) | #16 | $15,000 | 3.0 in (2017-04-16) |
| Hutchinson | 153 | #18 | 23 (#16) | #15 | $10,000 | 3.0 in (2019-06-18) |
| Gray | 140 | #21 | 29 (#11) | #21 | $13,000 | 4.5 in (2023-06-13) |
| Lubbock | 115 | #28 | 19 (#24) | #29 | $388.1 million | 4.5 in (2015-05-08) |
| Deaf Smith | 113 | #29 | 15 (#36) | #58 | $38,000 | 3.23 in (2019-06-15) |
| Moore | 87 | #43 | 7 (#117) | #43 | $200,000 | 2.75 in (2017-06-08) |
| Oldham | 61 | #74 | 9 (#84) | #130 | $24,000 | 3.25 in (2020-06-22) |
| Hockley | 58 | #76 | 12 (#53) | #77 | $3.2 million | 5.0 in (2024-05-28) |
| Armstrong | 48 | #96 | 9 (#77) | #99 | $50,000 | 4.25 in (2025-06-08) |
| Hale | 46 | #105 | 10 (#71) | #114 | $300.6 million | 4.5 in (2015-05-27) |
| Lynn | 42 | #115 | 7 (#115) | #111 | $80,600 | 3.25 in (2025-06-06) |
| Crosby | 36 | #124 | 5 (#138) | #131 | $1.2 million | 2.75 in (2015-05-05) |
| Castro | 31 | #147 | 7 (#103) | #146 | $0 | 3.5 in (2025-04-23) |
| Swisher | 30 | #156 | 11 (#63) | #152 | $1.6 million | 7.02 in (2024-06-02) |
Hail Season Calendar: Amarillo vs. Lubbock
Hail reports by the month the event began, 2015 through 2025. Amarillo is Potter plus Randall counties (412 reports). Lubbock is Lubbock County (115 reports).
Biggest Hailstones in the Texas Panhandle
Largest reported hail in the 26 Panhandle counties, 2015 through 2025.
| Size (in) | Date | County | Near | NOAA event |
|---|---|---|---|---|
| 7.02 | 2024-06-02 | Swisher | VIGO PARK | 1174108 |
| 6.0 | 2024-06-02 | Briscoe | CAPROCK CANYONS STATE PARK | 1174109 |
| 5.5 | 2019-05-20 | Collingsworth | WELLINGTON | 826585 |
| 5.5 | 2023-06-13 | Wheeler | LELA | 1107334 |
| 4.5 | 2023-06-13 | Gray | PAMPA | 1107315 |
| 4.5 | 2025-06-06 | Wheeler | BRISCOE | 1271845 |
| 4.25 | 2025-06-08 | Armstrong | CLAUDE | 1268201 |
| 4.0 | 2019-05-20 | Collingsworth | WELLINGTON | 826583 |
| 4.0 | 2022-06-07 | Ochiltree | FARNSWORTH | 1038612 |
| 4.0 | 2023-06-13 | Gray | MC LEAN | 1107333 |
State Ranking: Hail Reports per 1,000 Square Miles
All 50 states, ranked by hail reports per year per 1,000 square miles of land, 2015 through 2025.
| # | State | Per 1,000 sq mi / yr | Total reports | Total rank | 2 in+ |
|---|---|---|---|---|---|
| 1 | Kansas | 9.19 | 8,265 | #2 | 903 |
| 2 | Oklahoma | 7.81 | 5,894 | #4 | 740 |
| 3 | Nebraska | 7.19 | 6,079 | #3 | 746 |
| 4 | Iowa | 6.08 | 3,736 | #9 | 294 |
| 5 | Missouri | 5.83 | 4,411 | #7 | 362 |
| 6 | South Dakota | 5.76 | 4,801 | #6 | 470 |
| 7 | Illinois | 5.23 | 3,195 | #10 | 207 |
| 8 | Texas | 4.9 | 14,072 | #1 | 2,137 |
| 9 | Minnesota | 4.8 | 4,203 | #8 | 383 |
| 10 | New Jersey | 4.46 | 361 | #35 | 6 |
| 11 | Wisconsin | 4.4 | 2,620 | #12 | 195 |
| 12 | Colorado | 4.31 | 4,913 | #5 | 622 |
| 13 | Indiana | 4.17 | 1,643 | #19 | 113 |
| 14 | Arkansas | 3.9 | 2,230 | #13 | 230 |
| 15 | Ohio | 3.89 | 1,749 | #16 | 67 |
| 16 | Massachusetts | 3.88 | 333 | #37 | 6 |
| 17 | Maryland | 3.84 | 410 | #33 | 22 |
| 18 | Tennessee | 3.73 | 1,690 | #17 | 83 |
| 19 | South Carolina | 3.65 | 1,207 | #28 | 37 |
| 20 | North Dakota | 3.56 | 2,705 | #11 | 257 |
| 21 | Kentucky | 3.53 | 1,534 | #21 | 105 |
| 22 | Virginia | 3.06 | 1,329 | #25 | 57 |
| 23 | North Carolina | 3.03 | 1,623 | #20 | 65 |
| 24 | West Virginia | 2.86 | 757 | #32 | 37 |
| 25 | Pennsylvania | 2.84 | 1,400 | #23 | 50 |
| 26 | New Hampshire | 2.82 | 278 | #38 | 3 |
| 27 | Mississippi | 2.73 | 1,411 | #22 | 99 |
| 28 | Rhode Island | 2.73 | 31 | #48 | 0 |
| 29 | Louisiana | 2.57 | 1,224 | #27 | 88 |
| 30 | Alabama | 2.42 | 1,349 | #24 | 121 |
| 31 | Delaware | 2.29 | 49 | #47 | 2 |
| 32 | Georgia | 1.98 | 1,257 | #26 | 41 |
| 33 | Connecticut | 1.95 | 104 | #44 | 2 |
| 34 | Florida | 1.71 | 1,012 | #29 | 42 |
| 35 | Wyoming | 1.7 | 1,811 | #15 | 163 |
| 36 | New York | 1.59 | 825 | #31 | 31 |
| 37 | Michigan | 1.54 | 962 | #30 | 68 |
| 38 | Montana | 1.26 | 2,015 | #14 | 204 |
| 39 | New Mexico | 1.25 | 1,669 | #18 | 136 |
| 40 | Vermont | 1.15 | 117 | #43 | 0 |
| 41 | Maine | 0.76 | 257 | #39 | 6 |
| 42 | Arizona | 0.32 | 401 | #34 | 10 |
| 43 | Idaho | 0.28 | 252 | #40 | 8 |
| 44 | California | 0.21 | 355 | #36 | 3 |
| 45 | Utah | 0.19 | 169 | #41 | 1 |
| 46 | Oregon | 0.15 | 161 | #42 | 7 |
| 47 | Washington | 0.1 | 75 | #46 | 2 |
| 48 | Nevada | 0.07 | 85 | #45 | 1 |
| 49 | Hawaii | 0.03 | 2 | #50 | 0 |
| 50 | Alaska | 0.0 | 6 | #49 | 0 |
Methodology
- Source. NOAA National Centers for Environmental Information (NCEI) Storm Events Database, bulk "details" files for 2015 through 2025 (11 complete years). Only records with event type "Hail" were used.
- Counting. Each Storm Events hail record counts as one report. "Large hail" means a reported size (MAGNITUDE) of 2.00 inches or more. Months use the event begin date.
- Normalizing. County and state land areas come from the U.S. Census Bureau 2024 Gazetteer county file. State land area is the sum of its counties. Per-area figures are reports per year per 1,000 square miles of land.
- Damage. DAMAGE_PROPERTY values were summed as reported. NOAA damage estimates are often blank or zero and come from a mix of sources, so totals are incomplete and not comparable to insured losses.
- Panhandle. The 26 northernmost Texas counties, from Dallam and Lipscomb south to Parmer, Castro, Swisher, Briscoe, Hall and Childress.
- Caveats. Reports depend on people seeing and reporting hail. Cities and spotter networks produce more reports than empty ranch land, so urban counties are favored and rural counties are undercounted. A report is not a count of storms or damaged homes. Records are as published by NOAA when downloaded in October 2026 and may be revised.
Free to Use
Free to use with credit and a link to CRS Roofing & Construction. Please cite "CRS Roofing & Construction analysis of NOAA Storm Events data" and link to https://crsroofer.com/texas-hail-study.
Texas Hail Study FAQ
Which Texas county gets the most hail?
From 2015 through 2025, Tarrant County had the most hail reports in the NOAA Storm Events Database, with 482 reports. Tarrant also ranked first on reports per 1,000 square miles.
Where does Amarillo rank for hail in Texas?
Amarillo sits in two counties. Randall County ranked #6 and Potter County ranked #7 of 254 Texas counties by hail reports from 2015 through 2025, with 209 and 203 reports.
When is hail season in Amarillo and Lubbock?
May is the peak. 43% of Potter and Randall county hail reports and 54% of Lubbock County hail reports in the study period began in May. April through June covers most of the season.
What is the biggest hailstone in the Texas Panhandle in this data?
A 7.02 inch hailstone was reported near Vigo Park in Swisher County on June 2, 2024 (NOAA event 1174108). It was also the largest hail report in Texas in the 2015 to 2025 data.
Does Texas get more hail than any other state?
Texas logged 14,072 hail reports from 2015 through 2025, the most of any state. Adjusted for land area, Texas ranks #8 with 4.9 reports per 1,000 square miles per year. Kansas ranks #1 on that measure.
Can I use this data in a story?
Yes. The tables and charts are free to use with credit and a link to CRS Roofing & Construction at https://crsroofer.com/texas-hail-study.
Media kit: download graphics
Maps, charts and square stat cards sized for TV (1920x1080) and social (1080x1080), in PNG and SVG. Free to use with credit to CRS Roofing & Construction.