Texas Panhandle Wind and Tornado Damage Study (2015 to 2025)
A CRS Roofing & Construction data study. Source: NOAA NCEI Storm Events Database, 2015 through 2025.
Headline finding
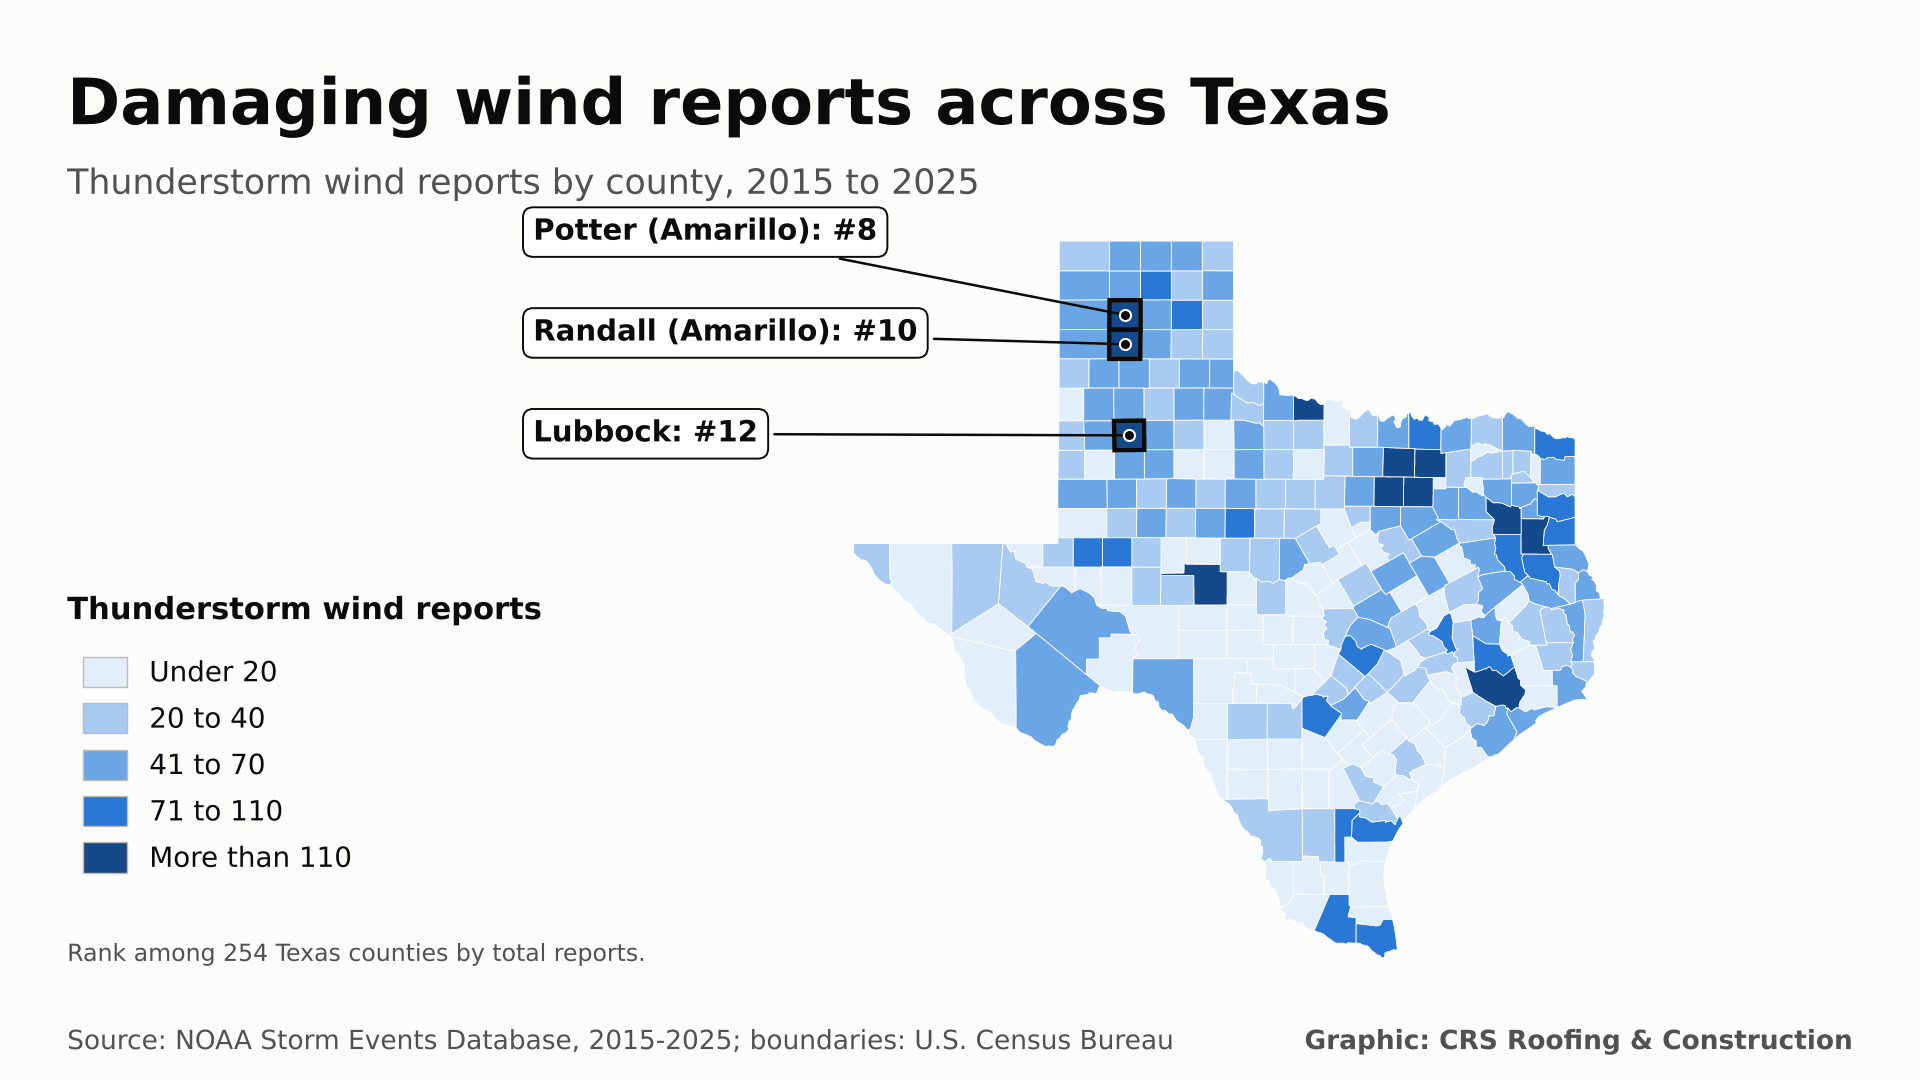
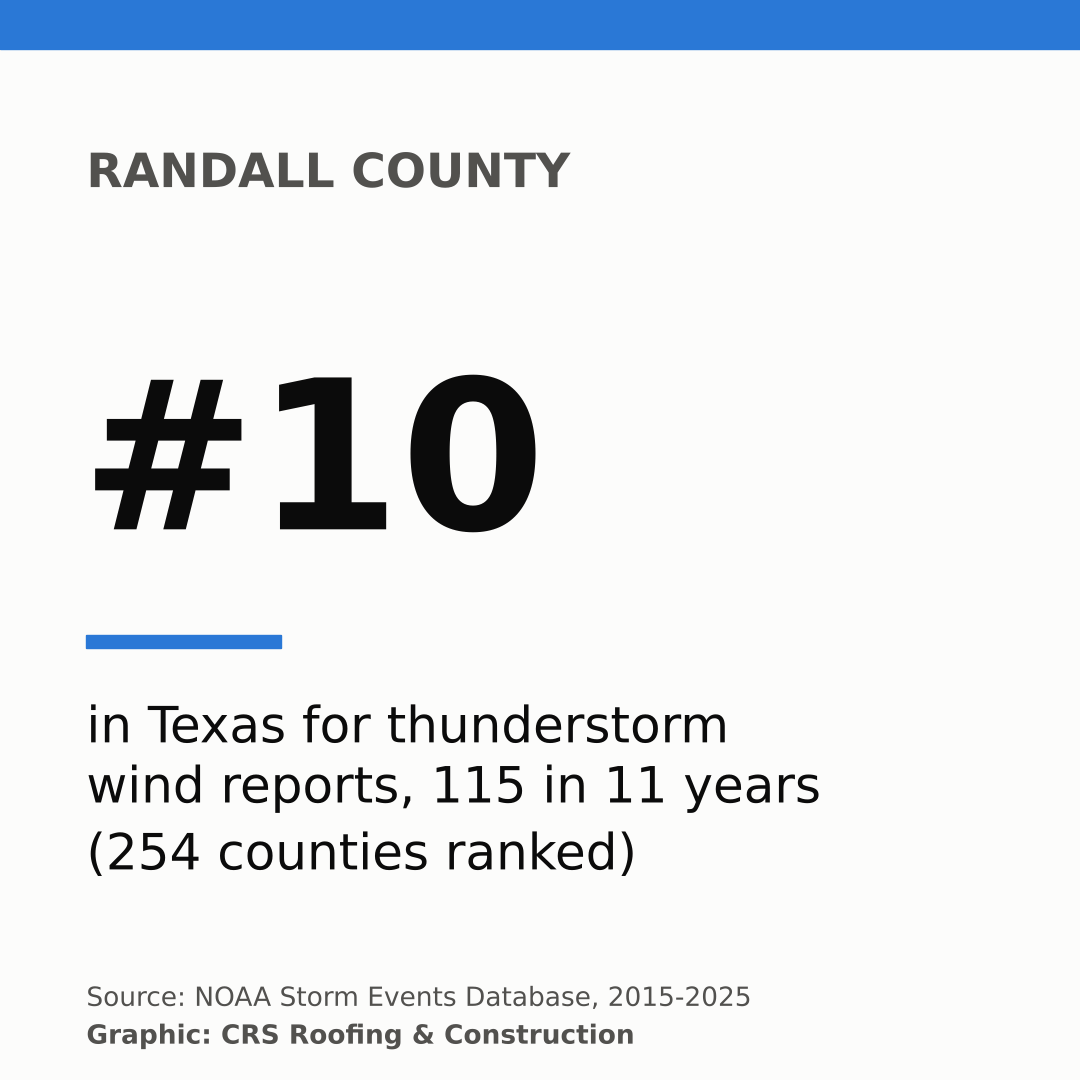
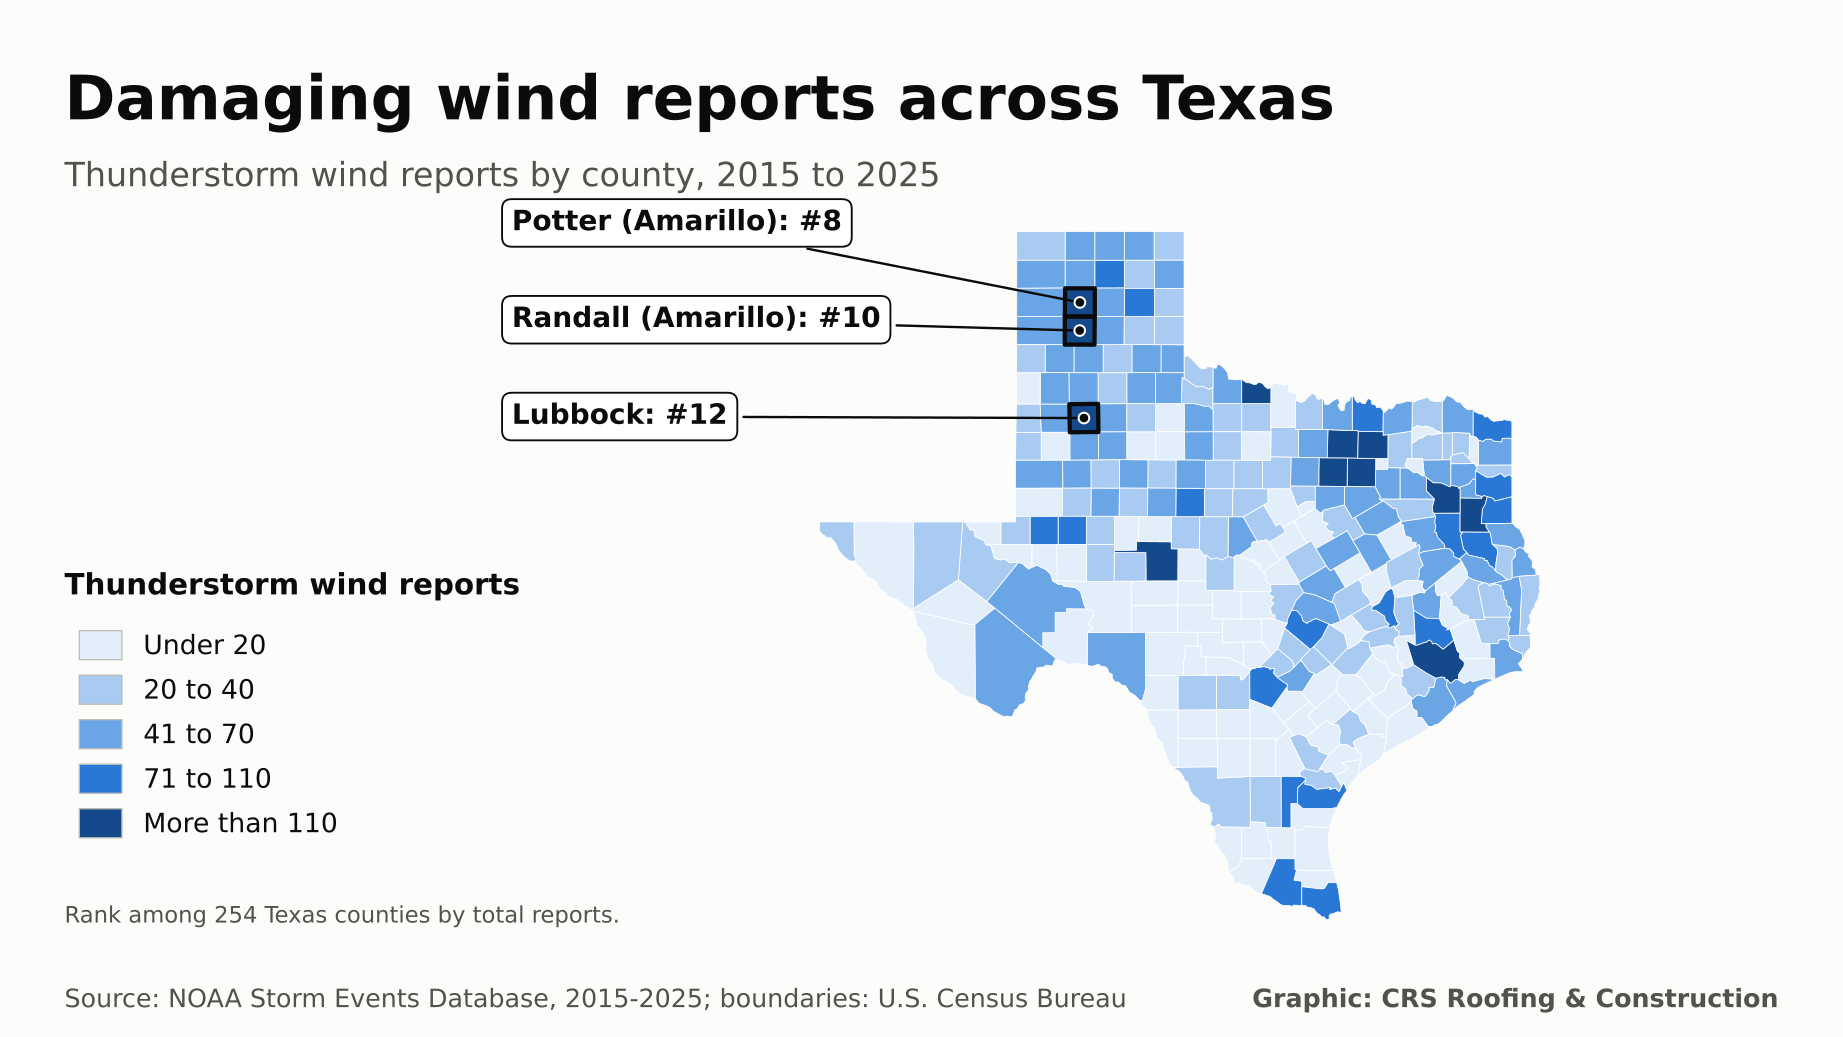
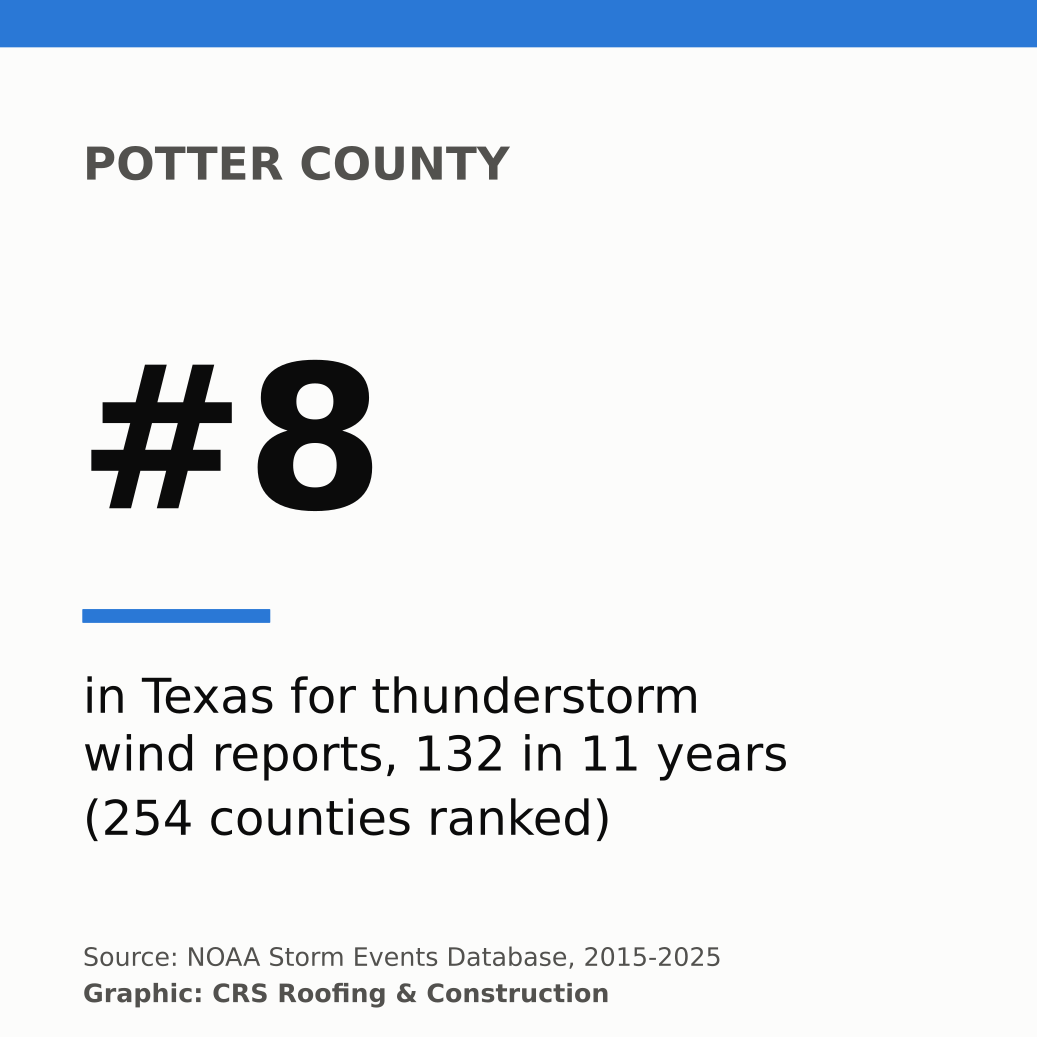
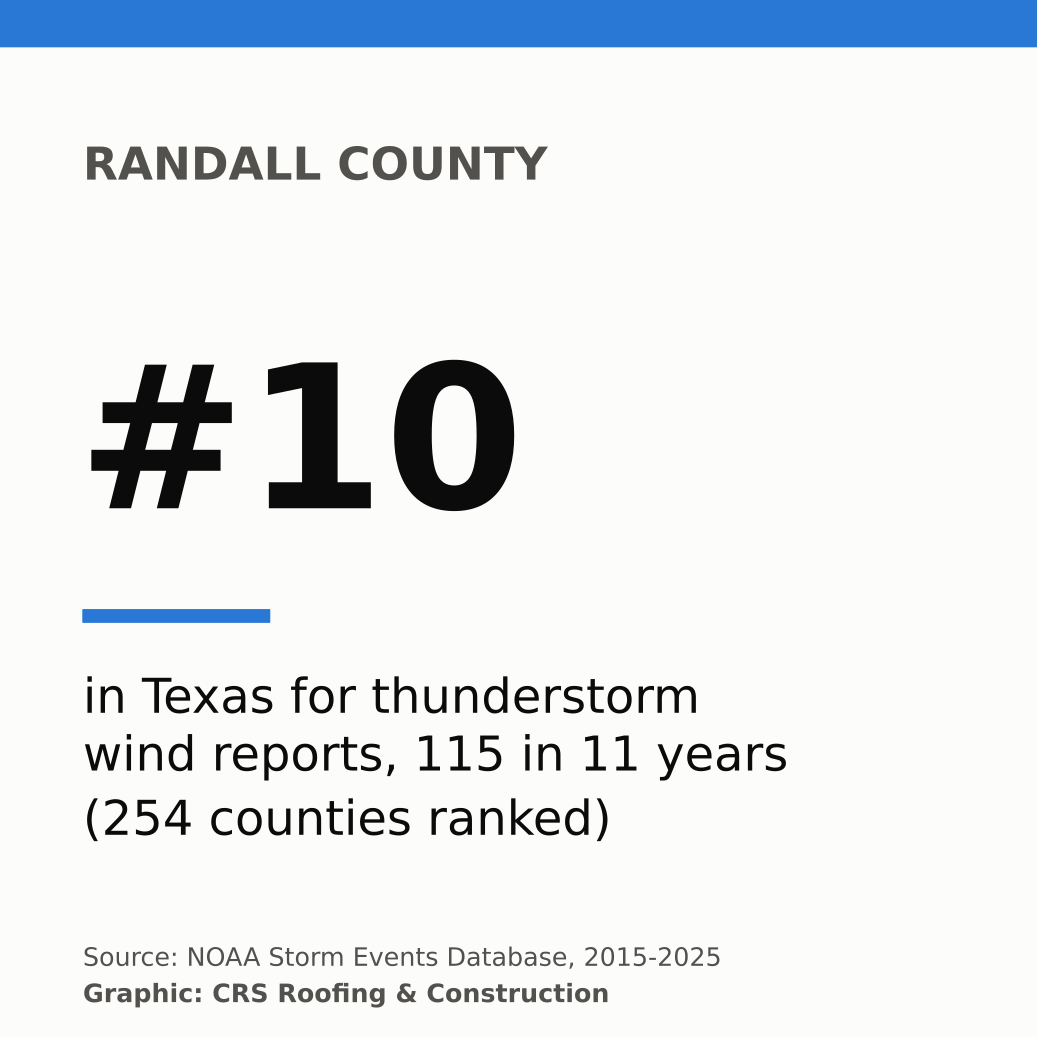
Amarillo's two counties both rank in the top 10 of all 254 Texas counties for damaging thunderstorm wind reports: Potter (#8) and Randall (#10), with 247 reports combined from 2015 through 2025. Lubbock County ranks #12. In the Panhandle, a gust of 114 mph was measured in Hall County on 2023-02-26.
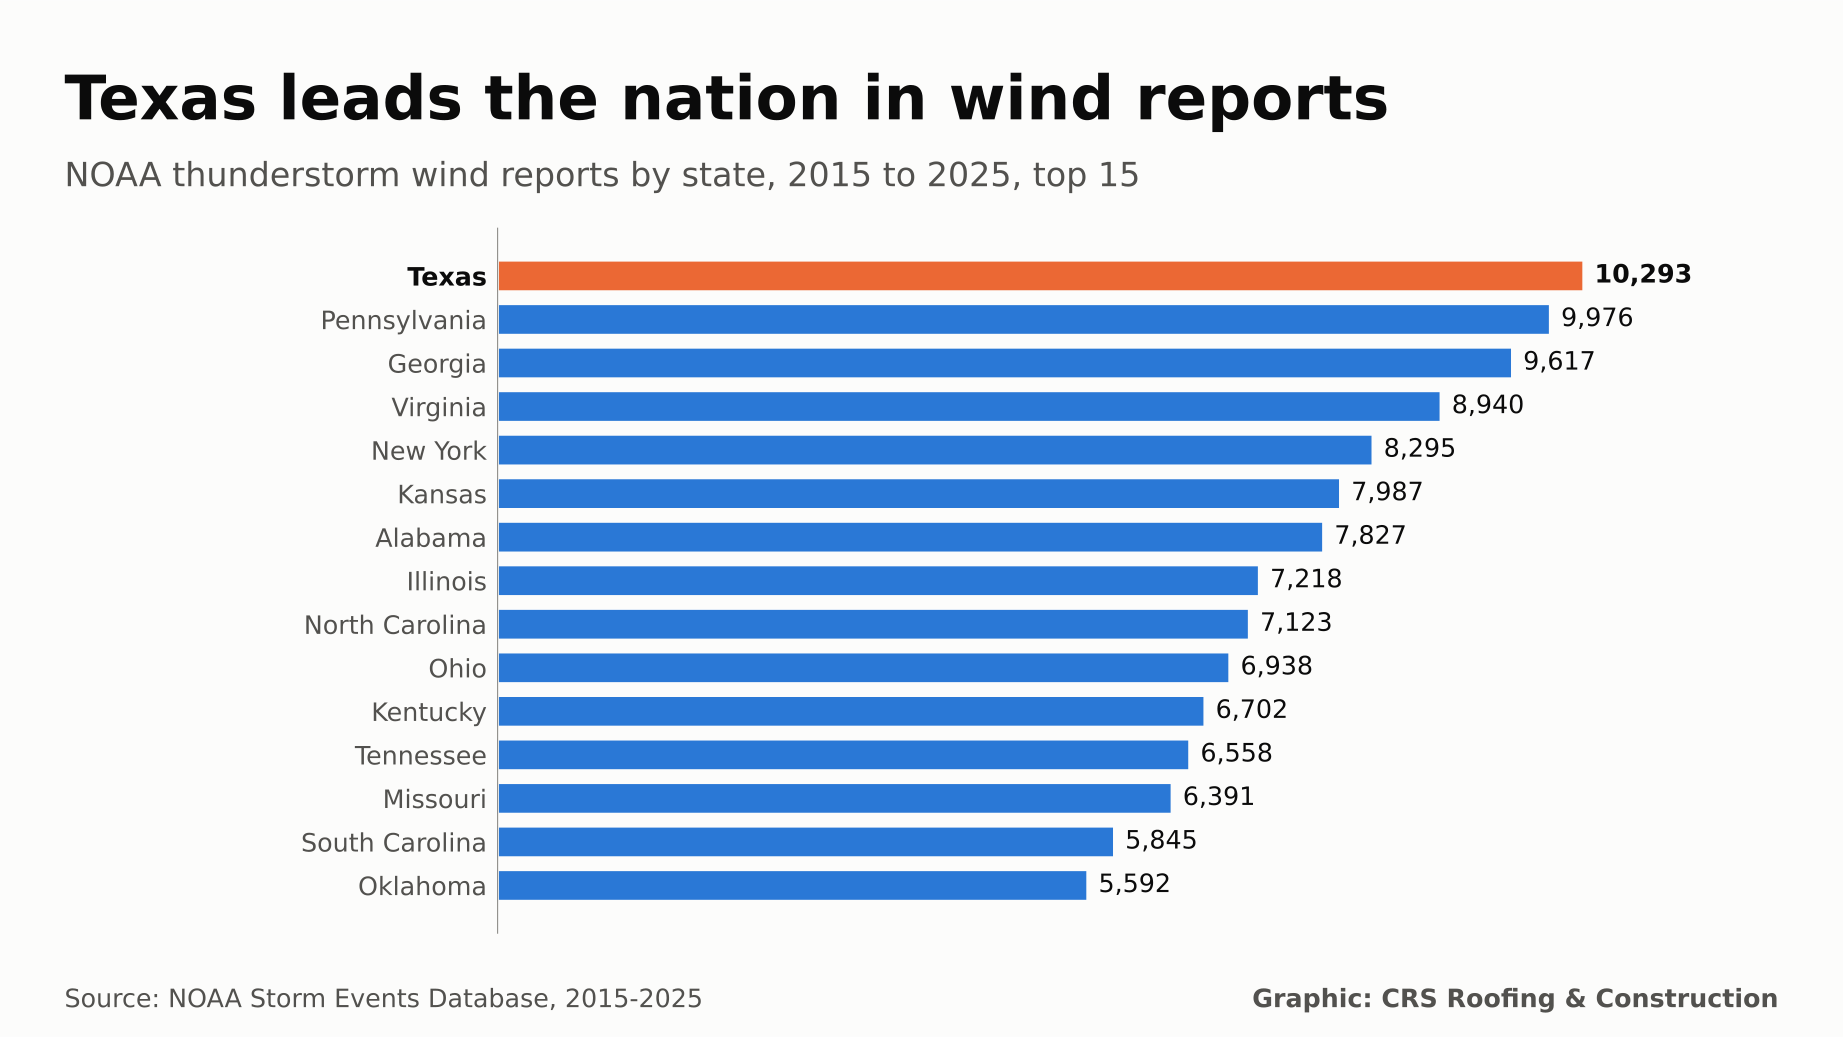
10,293
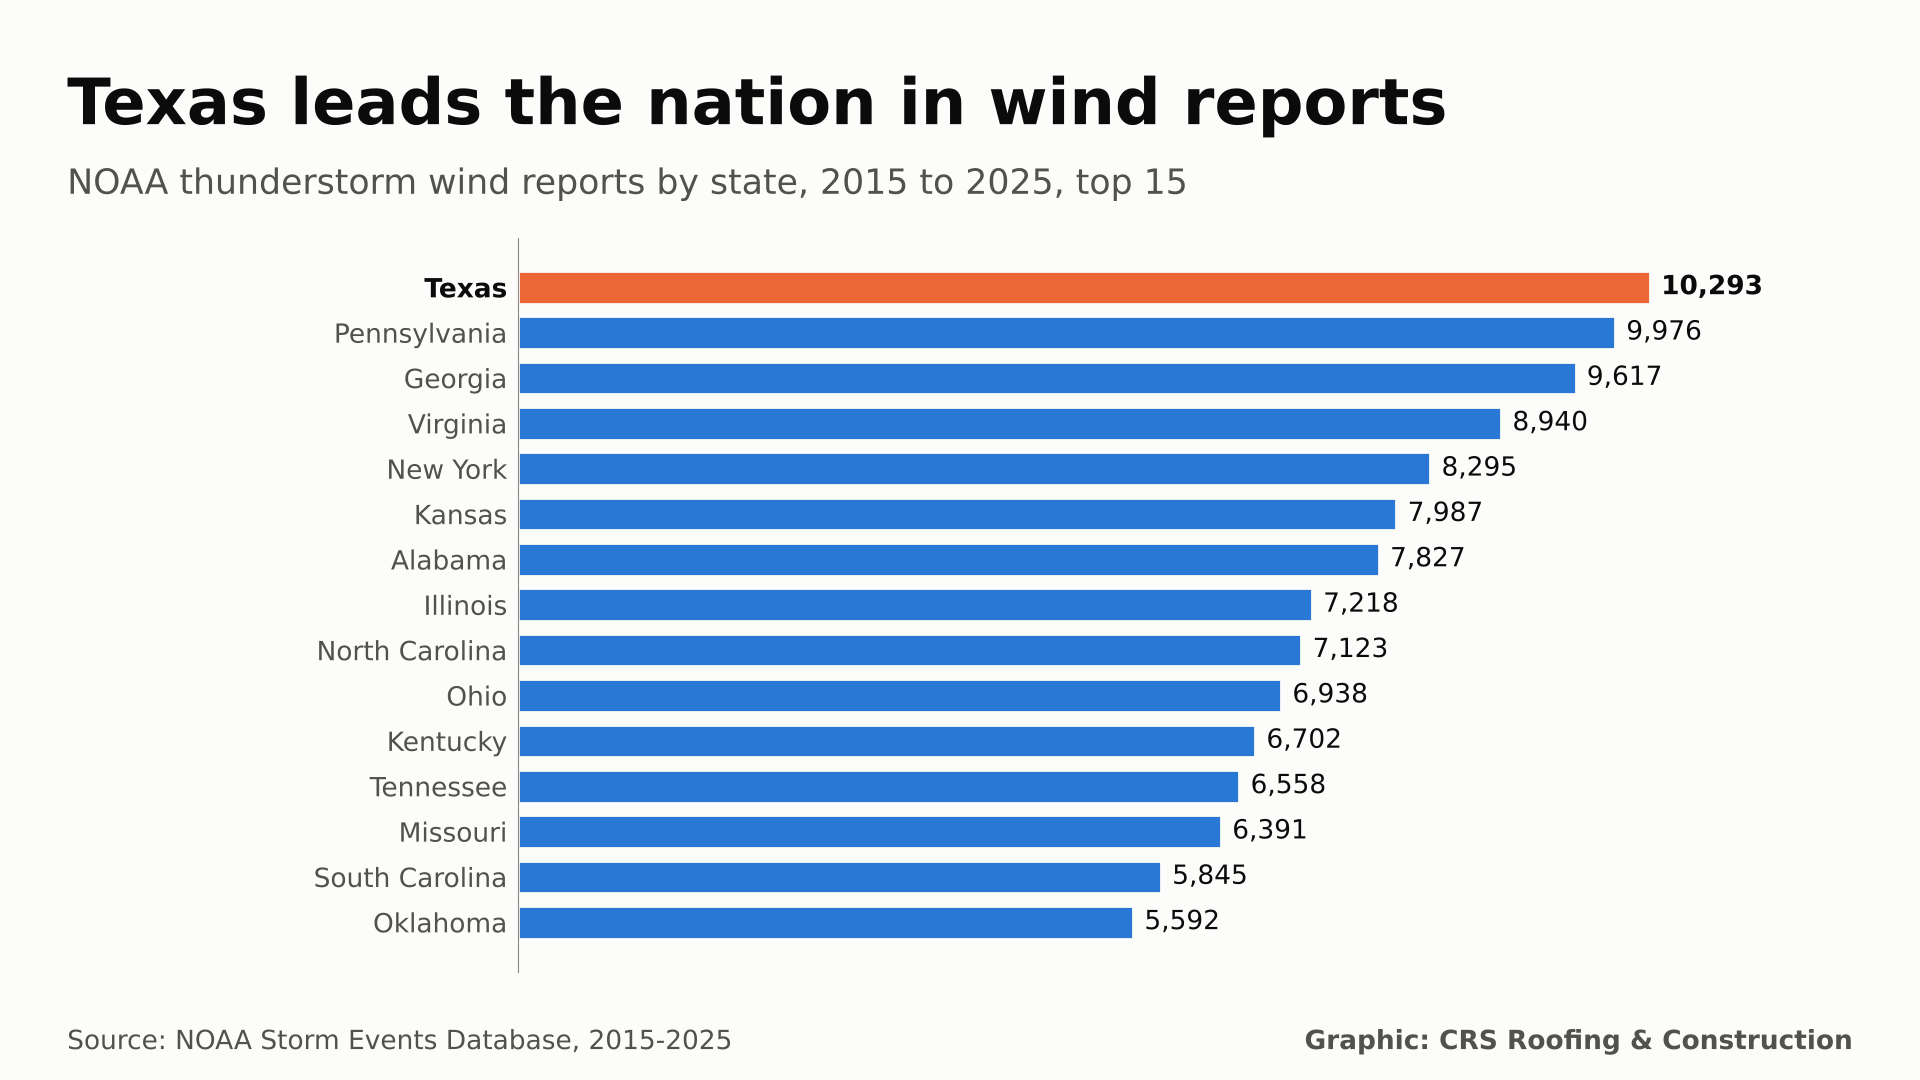
Texas thunderstorm wind reports, 2015 to 2025 (#1 of 50 states)
1,502
Texas tornado records (#1 of 50 states)
114 mph
Strongest measured Panhandle gust: Hall County, 2023-02-26
87%
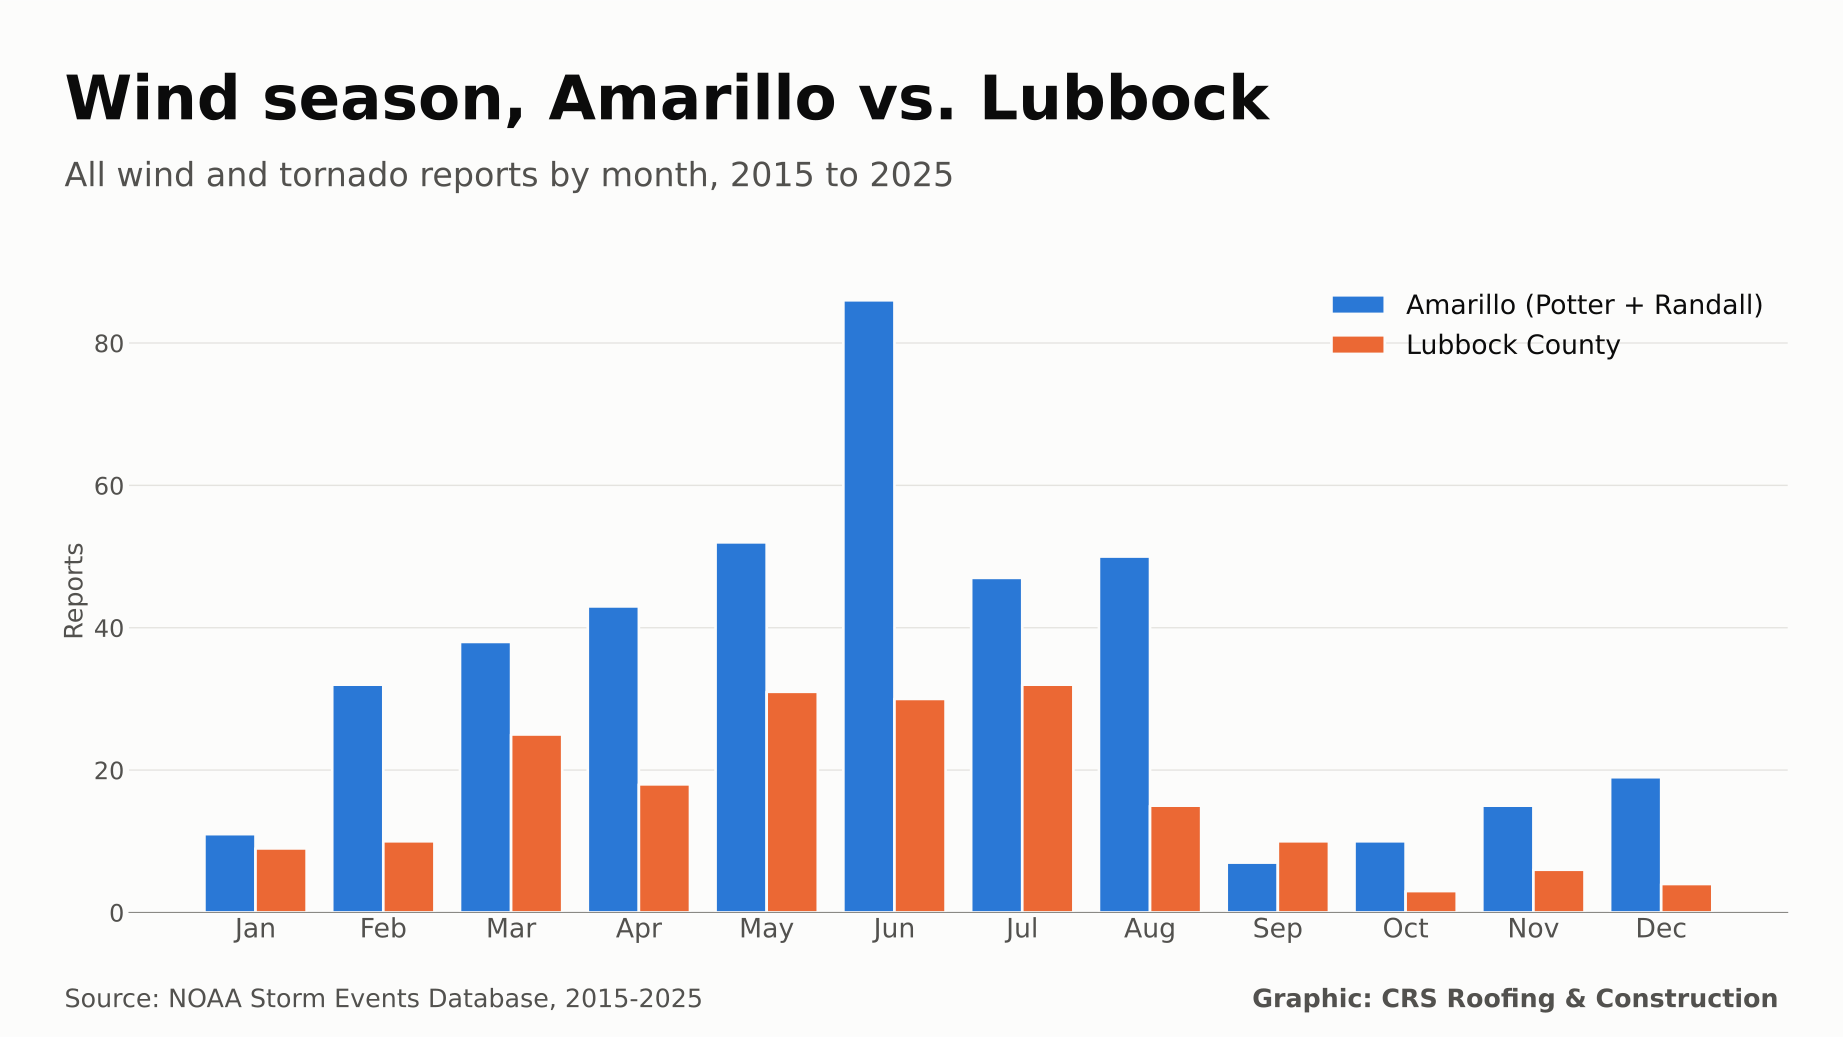
Share of Amarillo-area thunderstorm wind reports from May through August
Key Findings
- Texas leads the nation in raw wind and tornado reports. 10,293 thunderstorm wind reports and 1,502 tornado records in 11 years. Texas is so large that, adjusted for land area, it ranks #35 for wind and #27 for tornadoes.
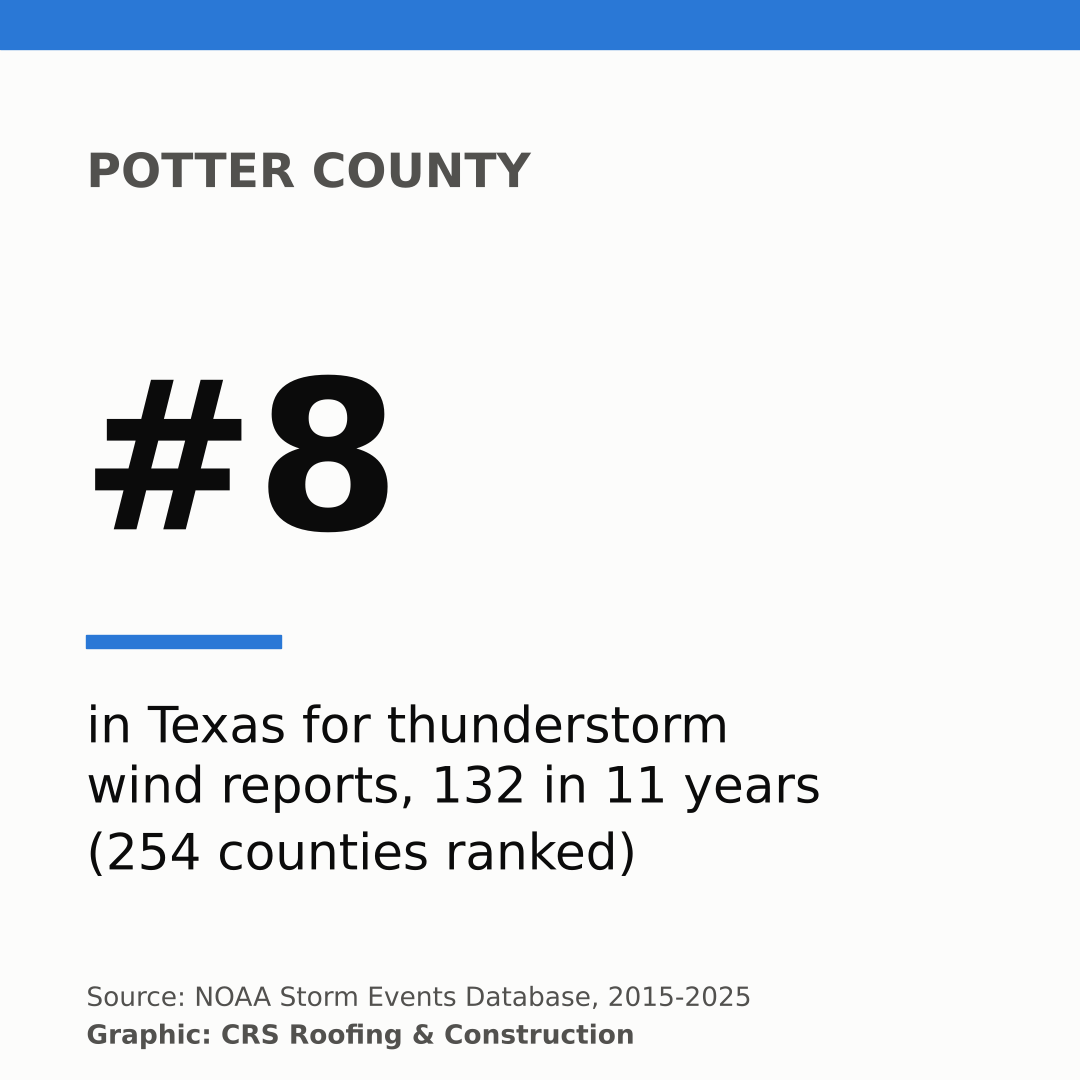
- Amarillo is a top 10 Texas wind county twice over. Potter County logged 132 thunderstorm wind reports (#8) and Randall County 115 (#10). Per square mile they rank #9 and #14.
- Panhandle gusts reach hurricane strength. The strongest measured gust in the 26 Panhandle counties was 114 mph in Hall County on 2023-02-26. The strongest estimated gust was 120 mph near Turkey in Hall County on 2017-08-13.
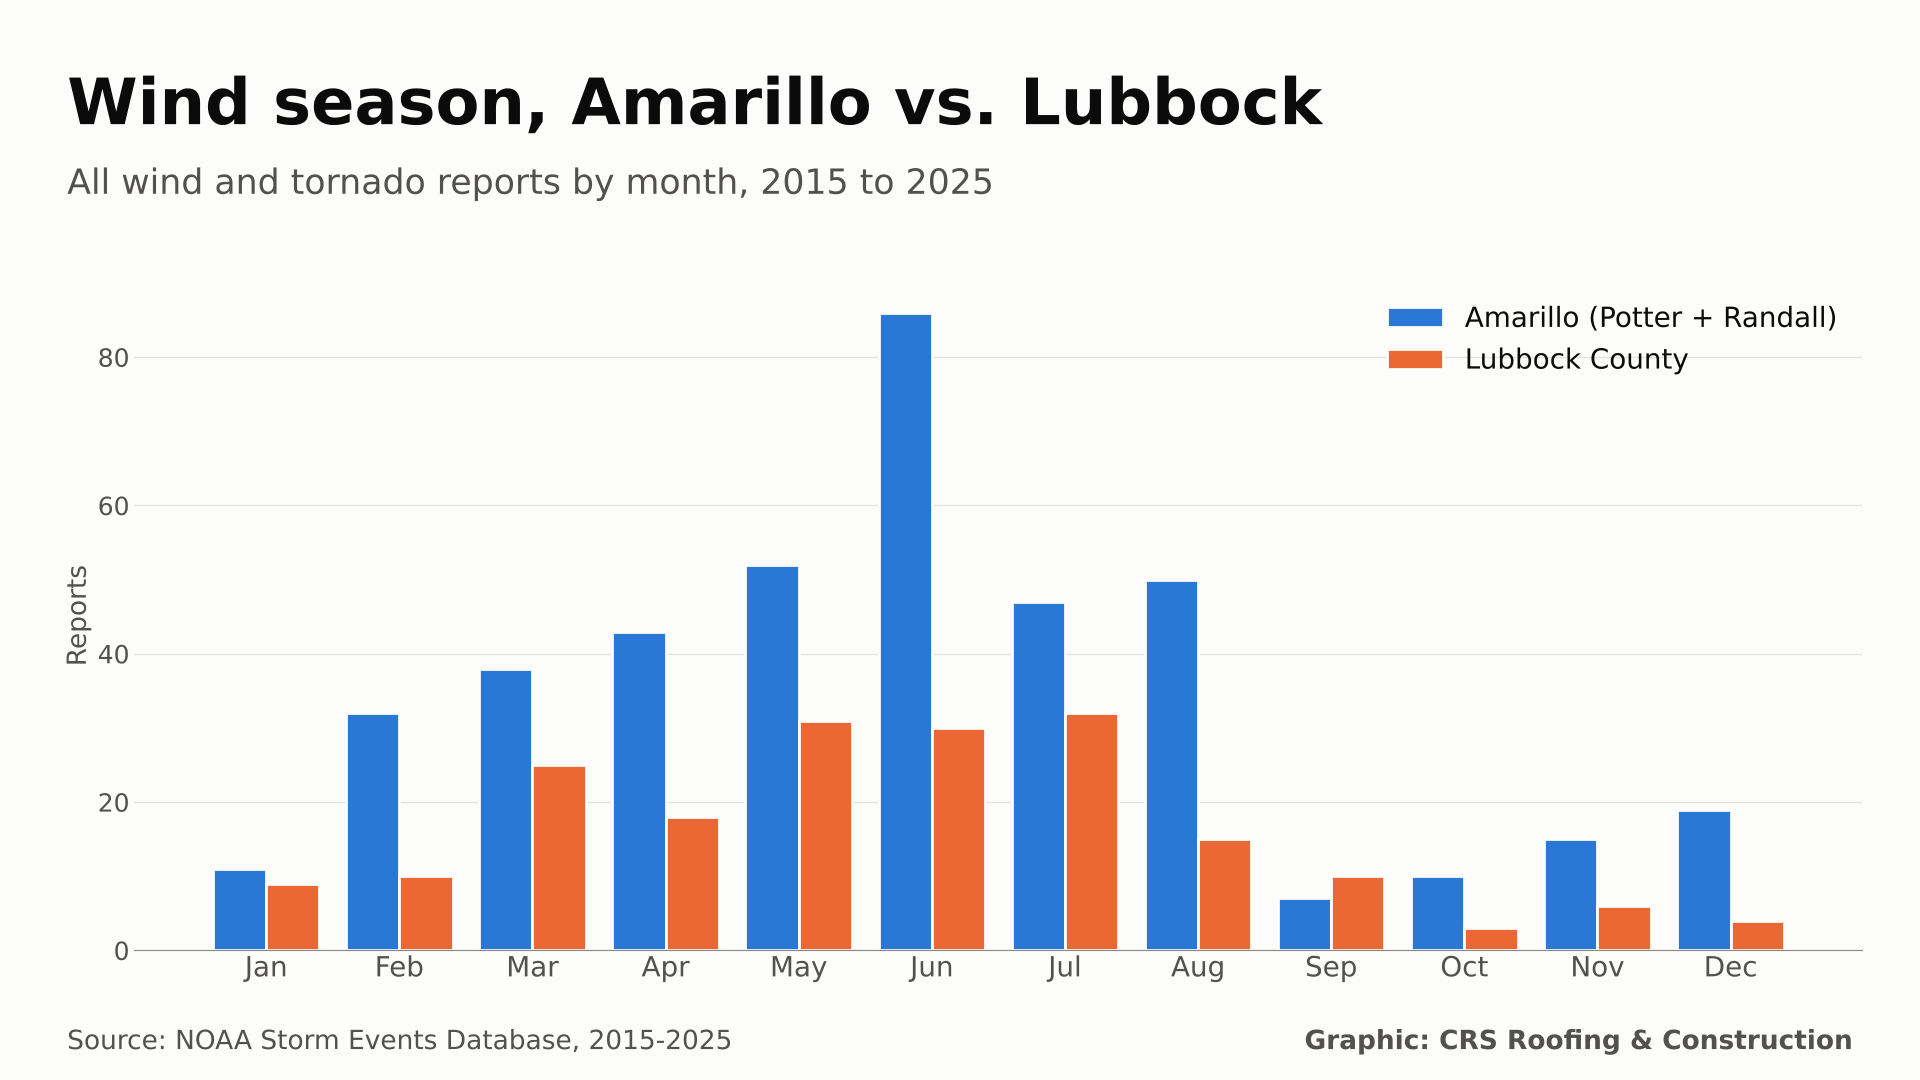
- Two wind seasons. Thunderstorm wind peaks in June (80 Amarillo-area reports). Non-thunderstorm high wind, driven by strong pressure systems, peaks from December through April (110 of 140 Amarillo-area high wind reports).
- Tornadoes are part of the picture. The Panhandle logged 234 tornado records, including 6 rated EF3. Hockley County, west of Lubbock, ranks #8 in Texas for tornado records and #4 for reported wind and tornado property damage ($37.1 million).
- Reported damage is a floor. NOAA records $369.9 million in Texas thunderstorm wind property damage and $2.34 billion in tornado damage, and $12.4 million across all five wind types in the Panhandle. Many records list no damage estimate at all.
Texas Top 25 Counties by Thunderstorm Wind Reports
Ranked by NOAA Storm Events thunderstorm wind reports, 2015 through 2025. "Per 1,000 sq mi" is reports per year per 1,000 square miles of land. Gusts are in mph, converted from knots. Measured and estimated gusts are shown separately.
| # | County | Reports | Per year | Per 1,000 sq mi | Tornadoes | Peak measured | Peak estimated |
|---|---|---|---|---|---|---|---|
| 1 | Tarrant | 281 | 25.5 | 29.52 | 22 | 83 | 105 |
| 2 | Rusk | 202 | 18.4 | 19.87 | 18 | 70 | 100 |
| 3 | Harris | 191 | 17.4 | 10.17 | 38 | 97 | 104 |
| 4 | Tom Green | 187 | 17.0 | 11.17 | 5 | 87 | 110 |
| 5 | Smith | 157 | 14.3 | 15.49 | 16 | 70 | 100 |
| 6 | Dallas | 156 | 14.2 | 16.24 | 16 | 89 | 96 |
| 7 | Denton | 153 | 13.9 | 15.83 | 14 | 86 | 96 |
| 8 | Potter | 132 | 12.0 | 13.21 | 6 | 93 | 86 |
| 9 | Wichita | 119 | 10.8 | 17.24 | 11 | 76 | 105 |
| 10 | Randall | 115 | 10.5 | 11.45 | 12 | 91 | 104 |
| 11 | Collin | 113 | 10.3 | 12.21 | 12 | 77 | 85 |
| 12 | Lubbock | 112 | 10.2 | 11.37 | 4 | 86 | 115 |
| 13 | Bexar | 108 | 9.8 | 7.92 | 6 | 77 | 85 |
| 14 | Travis | 108 | 9.8 | 9.87 | 9 | 75 | 85 |
| 15 | Nueces | 107 | 9.7 | 11.59 | 6 | 78 | 115 |
| 16 | Hutchinson | 104 | 9.5 | 10.65 | 11 | 87 | 86 |
| 17 | Gray | 103 | 9.4 | 10.11 | 12 | 89 | 90 |
| 18 | Taylor | 98 | 8.9 | 9.73 | 5 | 82 | 96 |
| 19 | Grayson | 96 | 8.7 | 9.36 | 8 | 75 | 90 |
| 20 | Hidalgo | 94 | 8.5 | 5.44 | 3 | 74 | 96 |
| 21 | Bowie | 89 | 8.1 | 9.14 | 12 | 64 | 96 |
| 22 | Midland | 89 | 8.1 | 8.99 | 5 | 112 | 110 |
| 23 | Harrison | 87 | 7.9 | 8.79 | 24 | 60 | 105 |
| 24 | Montgomery | 81 | 7.4 | 7.07 | 8 | 66 | 78 |
| 25 | Panola | 81 | 7.4 | 9.08 | 16 | 62 | 120 |
Texas Top 15 Counties by Tornado Records
Tornado records (county segments), 2015 through 2025, with the per-area rate per 1,000 square miles per year.
| # | County | Tornadoes | Per year | Per 1,000 sq mi | Per-area rank |
|---|---|---|---|---|---|
| 1 | Harris | 38 | 3.45 | 2.023 | #7 |
| 2 | Pecos | 30 | 2.73 | 0.572 | #121 |
| 3 | Harrison | 24 | 2.18 | 2.424 | #4 |
| 4 | Brazoria | 23 | 2.09 | 1.534 | #19 |
| 5 | Tarrant | 22 | 2.0 | 2.311 | #5 |
| 6 | Ochiltree | 21 | 1.91 | 2.08 | #6 |
| 7 | Rusk | 18 | 1.64 | 1.771 | #11 |
| 8 | Hockley | 17 | 1.55 | 1.701 | #12 |
| 9 | Jasper | 17 | 1.55 | 1.646 | #14 |
| 10 | Van Zandt | 17 | 1.55 | 1.834 | #9 |
| 15 | Smith | 16 | 1.45 | 1.578 | #18 |
| 11 | Dallas | 16 | 1.45 | 1.666 | #13 |
| 14 | Panola | 16 | 1.45 | 1.793 | #10 |
| 16 | Williamson | 16 | 1.45 | 1.304 | #30 |
| 12 | Hemphill | 16 | 1.45 | 1.605 | #15 |
Panhandle and South Plains Counties
Where the counties around Amarillo and Lubbock rank among all 254 Texas counties. Lower rank numbers mean more reports. "High wind" counts High Wind, Strong Wind and Dust Storm records, which NOAA logs by forecast zone. Homeowners can find local help through our Amarillo roofing, Lubbock roofing and Amarillo roof repair pages.
| County | T-storm wind (rank) | Per-area rank | High wind | Tornadoes (rank) | Peak measured (date) | Reported damage |
|---|---|---|---|---|---|---|
| Potter | 132 (#8) | #9 | 76 | 6 (#104) | 93 mph (2015-06-14) | $170,500 |
| Randall | 115 (#10) | #14 | 69 | 12 (#33) | 91 mph (2019-06-01) | $1.8 million |
| Lubbock | 112 (#12) | #15 | 77 | 4 (#148) | 86 mph (2025-06-05) | $3.2 million |
| Hutchinson | 104 (#16) | #17 | 74 | 11 (#40) | 87 mph (2023-09-21) | $192,700 |
| Gray | 103 (#17) | #20 | 66 | 12 (#31) | 89 mph (2023-06-27) | $207,000 |
| Deaf Smith | 69 (#33) | #101 | 55 | 5 (#116) | 85 mph (2015-06-14) | $96,000 |
| Hockley | 69 (#34) | #46 | 50 | 17 (#8) | 109 mph (2025-06-05) | $37.1 million |
| Carson | 68 (#36) | #49 | 50 | 11 (#36) | 81 mph (2025-03-14) | $157,000 |
| Moore | 65 (#40) | #51 | 76 | 5 (#130) | 81 mph (2023-02-26) | $275,000 |
| Hale | 62 (#44) | #62 | 45 | 7 (#77) | 81 mph (2024-05-28) | $3.4 million |
| Crosby | 57 (#55) | #58 | 34 | 8 (#63) | 98 mph (2020-08-02) | $5.1 million |
| Swisher | 56 (#59) | #60 | 54 | 6 (#108) | 81 mph (2025-03-14) | $563,000 |
| Oldham | 55 (#61) | #123 | 76 | 6 (#103) | 86 mph (2021-05-30) | $56,000 |
| Armstrong | 51 (#68) | #74 | 58 | 10 (#45) | 83 mph (2019-08-07) | $95,000 |
| Lynn | 45 (#87) | #87 | 32 | 2 (#192) | 96 mph (2024-05-29) | $1.6 million |
| Castro | 44 (#89) | #91 | 56 | 14 (#22) | 85 mph (2022-05-10) | $1.4 million |
Wind Season Calendar: Amarillo vs. Lubbock
All wind and tornado records (thunderstorm wind, high wind, strong wind, dust storm and tornado) by the month the event began, 2015 through 2025. Amarillo is Potter plus Randall counties (410 records). Lubbock is Lubbock County (193 records).
Strongest Gusts on Record in the Texas Panhandle
Measured gusts (MG)
Gusts recorded by an instrument such as an airport sensor or mesonet station, 2015 through 2025, in the 26 Panhandle counties.
| Gust (mph) | Date | County | Type | Near | NOAA event |
|---|---|---|---|---|---|
| 114 | 2023-02-26 | Hall | Thunderstorm Wind | Lesley | 1075349 |
| 96 | 2023-07-07 | Lipscomb | Thunderstorm Wind | Lipscomb | 1118038 |
| 94 | 2024-09-17 | Dallam | Thunderstorm Wind | Texline | 1211911 |
| 93 | 2015-06-14 | Potter | Thunderstorm Wind | Bushland | 591737 |
| 91 | 2019-06-01 | Randall | Thunderstorm Wind | Lake Tanglewood | 836295 |
| 90 | 2021-12-15 | Sherman | High Wind | Zone report | 996287 |
| 90 | 2025-06-07 | Hemphill | Thunderstorm Wind | Gageby | 1276767 |
| 90 | 2025-06-08 | Hall | Thunderstorm Wind | Brice | 1270745 |
| 89 | 2023-06-27 | Gray | Thunderstorm Wind | Pampa | 1113329 |
| 87 | 2019-06-15 | Childress | Thunderstorm Wind | (Cds)Childress Arpt | 826018 |
Estimated gusts (EG)
Gusts estimated by the National Weather Service, usually from damage surveys or spotter reports. These are not instrument readings.
| Gust (mph) | Date | County | Type | Near | NOAA event |
|---|---|---|---|---|---|
| 120 | 2017-08-13 | Hall | Thunderstorm Wind | Turkey | 707483 |
| 119 | 2017-06-20 | Sherman | Thunderstorm Wind | Lautz | 708028 |
| 115 | 2025-06-06 | Hansford | Thunderstorm Wind | Spearman | 1280543 |
| 110 | 2017-08-13 | Dallam | Thunderstorm Wind | Dalhart | 716667 |
| 110 | 2019-05-07 | Swisher | Thunderstorm Wind | Vigo Park | 813236 |
| 104 | 2017-06-08 | Randall | Thunderstorm Wind | Lake Tanglewood | 707284 |
| 100 | 2019-05-05 | Swisher | Thunderstorm Wind | Vigo Park | 813341 |
| 100 | 2020-07-09 | Hall | Thunderstorm Wind | Plaska | 901641 |
| 100 | 2023-02-26 | Wheeler | Thunderstorm Wind | Kelton | 1082794 |
| 100 | 2023-02-26 | Wheeler | Thunderstorm Wind | Shamrock | 1082784 |
Tornadoes by EF Scale
Tornado records by Enhanced Fujita rating, 2015 through 2025. EFU means the tornado could not be rated, often because it crossed open land with nothing to damage. "CRS counties" are the 16 Panhandle and South Plains counties in the table above.
| Rating | Texas | Panhandle | CRS counties |
|---|---|---|---|
| EF0 | 613 | 107 | 53 |
| EF1 | 416 | 43 | 18 |
| EF2 | 162 | 14 | 10 |
| EF3 | 45 | 6 | 3 |
| EF4 | 4 | 0 | 0 |
| EF5 | 0 | 0 | 0 |
| EFU | 262 | 64 | 52 |
Reported Property Damage by Event Type
Sum of NOAA DAMAGE_PROPERTY estimates, 2015 through 2025. Treat these as a floor, not a full loss count.
| Event type | Texas | Panhandle |
|---|---|---|
| Thunderstorm Wind | $369.9 million | $6.4 million |
| High Wind | $6.6 million | $570,000 |
| Strong Wind | $411,200 | $0 |
| Dust Storm | $525,000 | $100,000 |
| Tornado | $2.34 billion | $5.3 million |
State Ranking: Thunderstorm Wind and Tornadoes
All 50 states, ranked by thunderstorm wind reports per year per 1,000 square miles of land, 2015 through 2025.
| # | State | Wind per 1,000 sq mi / yr | Wind reports (rank) | Tornadoes (rank) | Tornado per-area rank |
|---|---|---|---|---|---|
| 1 | Maryland | 37.06 | 3,959 (#23) | 82 (#31) | #19 |
| 2 | New Jersey | 35.26 | 2,853 (#29) | 55 (#34) | #20 |
| 3 | Massachusetts | 24.48 | 2,101 (#32) | 39 (#37) | #28 |
| 4 | Delaware | 22.95 | 492 (#44) | 18 (#43) | #15 |
| 5 | Virginia | 20.59 | 8,940 (#4) | 182 (#26) | #29 |
| 6 | Pennsylvania | 20.27 | 9,976 (#2) | 265 (#24) | #26 |
| 7 | South Carolina | 17.67 | 5,845 (#14) | 320 (#22) | #10 |
| 8 | Connecticut | 17.38 | 926 (#40) | 31 (#38) | #25 |
| 9 | New York | 16.0 | 8,295 (#5) | 114 (#29) | #34 |
| 10 | Ohio | 15.44 | 6,938 (#10) | 429 (#16) | #11 |
| 11 | Kentucky | 15.43 | 6,702 (#11) | 414 (#18) | #12 |
| 12 | Rhode Island | 15.39 | 175 (#47) | 9 (#47) | #18 |
| 13 | Georgia | 15.15 | 9,617 (#3) | 637 (#10) | #8 |
| 14 | Tennessee | 14.46 | 6,558 (#12) | 421 (#17) | #13 |
| 15 | Alabama | 14.05 | 7,827 (#7) | 896 (#5) | #2 |
| 16 | West Virginia | 13.78 | 3,644 (#25) | 45 (#35) | #35 |
| 17 | North Carolina | 13.32 | 7,123 (#9) | 339 (#21) | #22 |
| 18 | Indiana | 12.4 | 4,886 (#20) | 405 (#19) | #7 |
| 19 | Illinois | 11.82 | 7,218 (#8) | 958 (#4) | #3 |
| 20 | Mississippi | 10.77 | 5,557 (#16) | 1,097 (#2) | #1 |
| 21 | New Hampshire | 9.35 | 921 (#41) | 14 (#44) | #36 |
| 22 | Florida | 8.88 | 5,243 (#18) | 588 (#12) | #9 |
| 23 | Kansas | 8.88 | 7,987 (#6) | 734 (#7) | #16 |
| 24 | Missouri | 8.45 | 6,391 (#13) | 647 (#9) | #14 |
| 25 | Iowa | 8.02 | 4,928 (#19) | 831 (#6) | #6 |
| 26 | Oklahoma | 7.41 | 5,592 (#15) | 1,077 (#3) | #5 |
| 27 | Louisiana | 6.89 | 3,274 (#27) | 712 (#8) | #4 |
| 28 | Vermont | 6.84 | 694 (#42) | 5 (#48) | #40 |
| 29 | South Dakota | 6.46 | 5,388 (#17) | 228 (#25) | #32 |
| 30 | Arkansas | 6.39 | 3,657 (#24) | 466 (#15) | #17 |
| 31 | Wisconsin | 5.88 | 3,504 (#26) | 351 (#20) | #24 |
| 32 | Nebraska | 5.63 | 4,757 (#21) | 513 (#13) | #23 |
| 33 | Minnesota | 5.05 | 4,420 (#22) | 591 (#11) | #21 |
| 34 | Michigan | 4.83 | 3,010 (#28) | 163 (#27) | #33 |
| 35 | Texas | 3.58 | 10,293 (#1) | 1,502 (#1) | #27 |
| 36 | North Dakota | 3.24 | 2,459 (#30) | 298 (#23) | #31 |
| 37 | Maine | 2.86 | 972 (#38) | 11 (#45) | #43 |
| 38 | Colorado | 1.53 | 1,741 (#33) | 471 (#14) | #30 |
| 39 | Utah | 1.52 | 1,382 (#35) | 21 (#42) | #47 |
| 40 | Montana | 1.5 | 2,396 (#31) | 41 (#36) | #45 |
| 41 | Arizona | 1.34 | 1,680 (#34) | 63 (#33) | #39 |
| 42 | Idaho | 1.2 | 1,087 (#37) | 21 (#41) | #46 |
| 43 | Wyoming | 1.06 | 1,137 (#36) | 110 (#30) | #37 |
| 44 | New Mexico | 0.71 | 952 (#39) | 122 (#28) | #38 |
| 45 | Nevada | 0.38 | 463 (#45) | 11 (#46) | #49 |
| 46 | California | 0.31 | 533 (#43) | 73 (#32) | #41 |
| 47 | Washington | 0.24 | 178 (#46) | 24 (#40) | #42 |
| 48 | Hawaii | 0.18 | 13 (#49) | 1 (#50) | #48 |
| 49 | Oregon | 0.13 | 139 (#48) | 29 (#39) | #44 |
| 50 | Alaska | 0.0 | 7 (#50) | 1 (#49) | #50 |
Signs of Wind Damage on Your Roof
Wind damage is easy to miss from the ground. After a strong gust event, look for:
- Lifted shingles. Tabs that have been pulled up and may have settled back down, breaking the adhesive seal underneath.
- Creasing. A horizontal fold line across a shingle where it bent back in the wind. A creased shingle has lost strength and can tear off in the next storm.
- Missing shingles or exposed felt. Bare spots, especially along ridges, rakes and roof edges where wind pressure is highest.
- Loose ridge caps, flashing and drip edge. Metal that is bent, lifted or rattling.
- Debris and granules. Shingle pieces in the yard or granules in gutters after a storm.
- Interior signs. New ceiling stains or attic leaks after a wind-driven rain.
Hail often arrives in the same storms. See our Texas hail study for county hail rankings.
Methodology
- Source. NOAA National Centers for Environmental Information (NCEI) Storm Events Database, bulk "details" files for 2015 through 2025 (11 complete years). Event types used: Thunderstorm Wind, High Wind, Strong Wind, Tornado and Dust Storm.
- Counting. Each Storm Events record counts as one report. County and state rankings use Thunderstorm Wind and Tornado records, which NOAA logs by county. High Wind, Strong Wind and Dust Storm are logged by forecast zone. Texas zones were matched to counties by name; 912 Texas zone records with non-county names (mostly West Texas mountain zones) could not be matched and are excluded from county tables.
- Gusts. MAGNITUDE is in knots and was converted to mph (1 knot = 1.15078 mph). MAGNITUDE_TYPE MG (measured gust) and EG (estimated gust) are kept apart. Sustained wind readings (MS, ES) are excluded from gust tables.
- Tornadoes. A tornado crossing a county line appears once per county, so counts are county segments. EF ratings are as listed in TOR_F_SCALE.
- Normalizing. County and state land areas come from the U.S. Census Bureau 2024 Gazetteer county file. Per-area figures are reports per year per 1,000 square miles of land.
- Damage. DAMAGE_PROPERTY values were summed as reported. Estimates are often blank or zero, so totals are incomplete and not comparable to insured losses.
- Panhandle. The 26 northernmost Texas counties, from Dallam and Lipscomb south to Parmer, Castro, Swisher, Briscoe, Hall and Childress.
- Caveats. Reports depend on people and instruments being there to observe wind. Cities and spotter networks produce more reports than ranch land. Thunderstorm wind reports usually mean gusts of 58 mph or more or wind damage, not every windy day. This study does not compare average wind speeds between cities. Records are as published by NOAA when downloaded in October 2026 and may be revised.
Free to Use
Free to use with credit and a link to CRS Roofing & Construction. Please cite "CRS Roofing & Construction analysis of NOAA Storm Events data" and link to https://crsroofer.com/texas-panhandle-wind-damage-study.
Panhandle Wind Study FAQ
Where does Amarillo rank for damaging wind in Texas?
Amarillo sits in Potter and Randall counties. From 2015 through 2025, Potter County ranked #8 and Randall County ranked #10 of 254 Texas counties by thunderstorm wind reports in the NOAA Storm Events Database, with 132 and 115 reports.
Where does Lubbock rank for damaging wind?
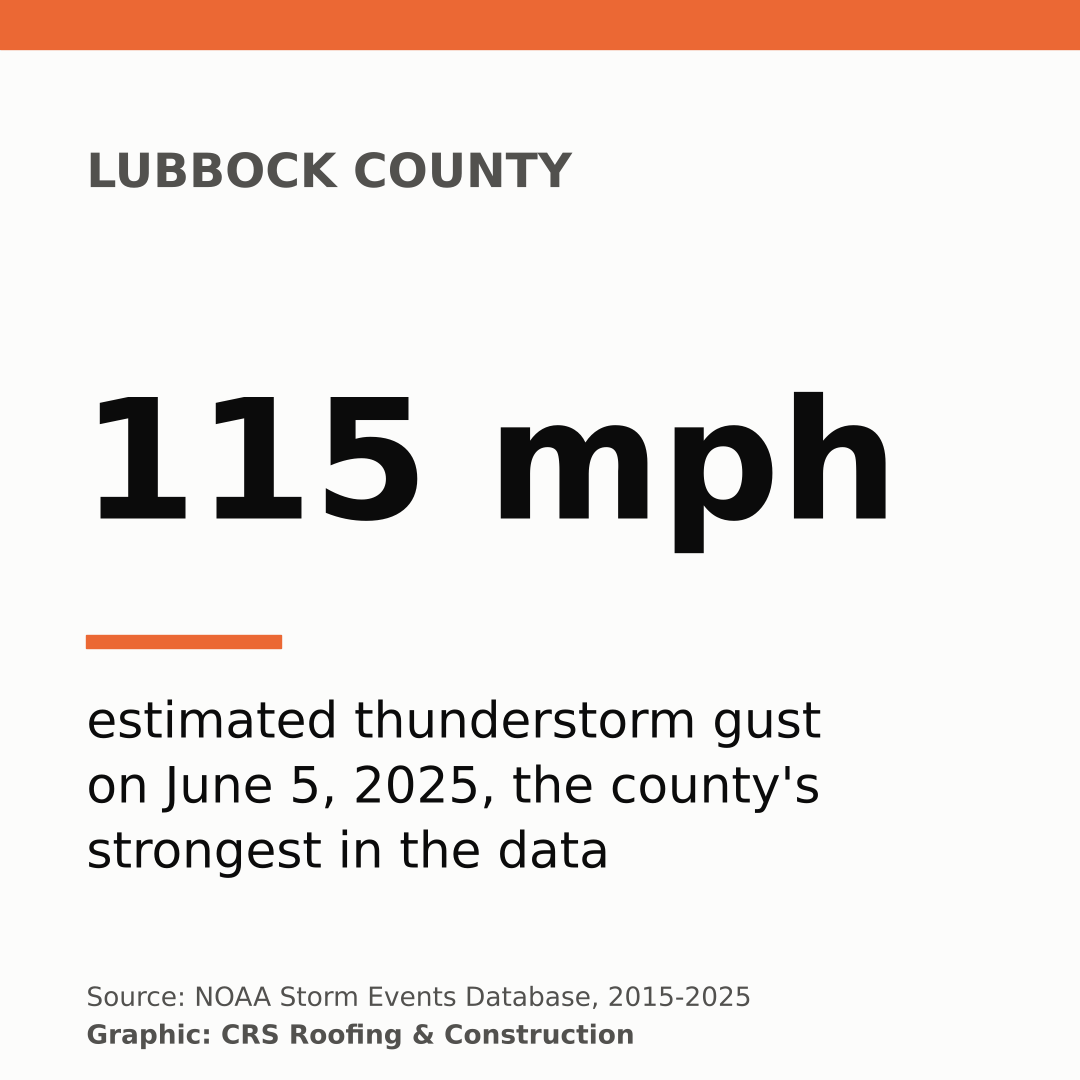
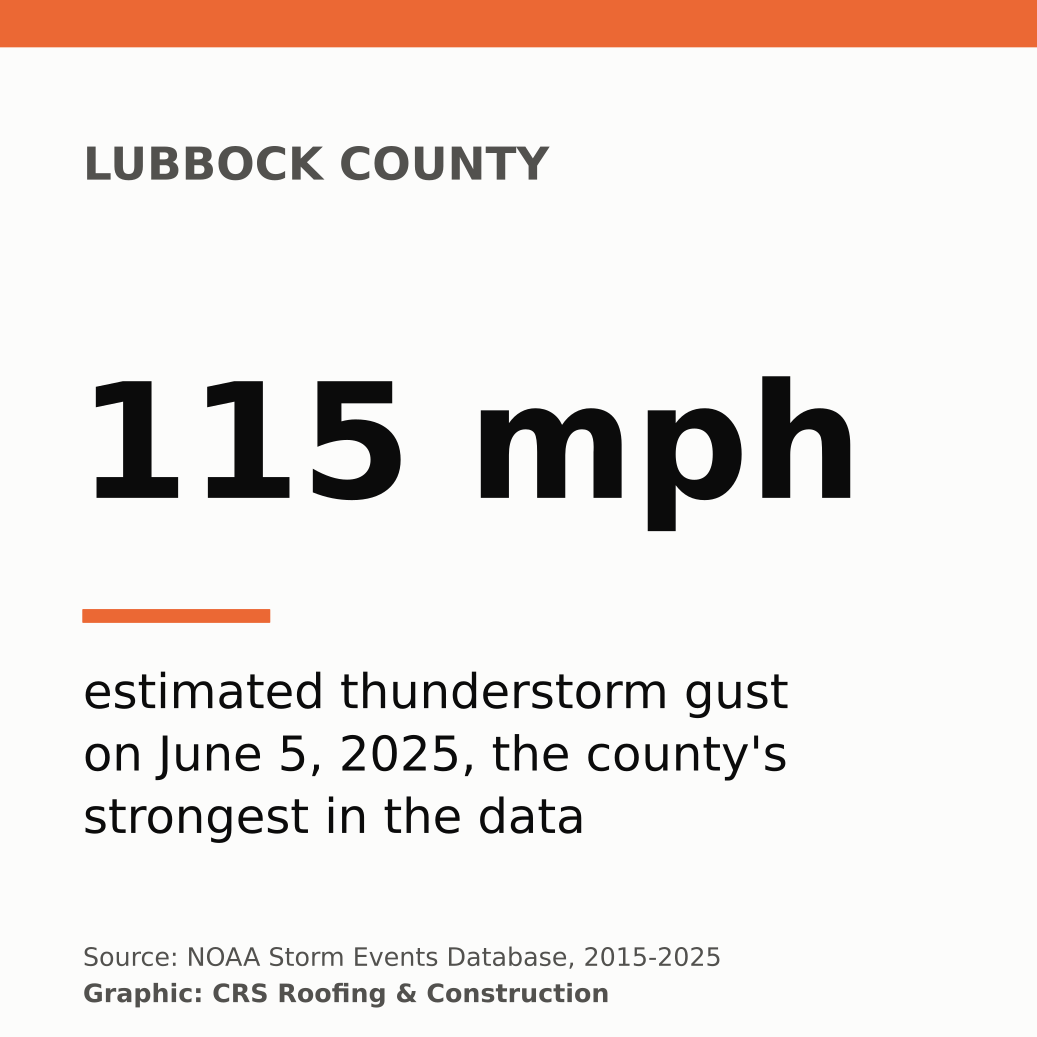
Lubbock County logged 112 thunderstorm wind reports from 2015 through 2025, #12 of 254 Texas counties. Its highest measured gust in the data was 86 mph on 2025-06-05.
What is the strongest measured wind gust in the Texas Panhandle in this data?
A 114 mph gust was measured on 2023-02-26 in Hall County during a thunderstorm wind event (NOAA event 1075349). The strongest estimated gust was 120 mph in Hall County on 2017-08-13. Measured and estimated gusts are reported separately.
When is wind season in Amarillo and Lubbock?
Thunderstorm wind peaks in late spring and summer. In Potter and Randall counties, 87% of thunderstorm wind reports began from May through August, with June the single busiest month. Non-thunderstorm high wind events cluster in winter and early spring, from December through April.
How many tornadoes hit Texas from 2015 through 2025?
NOAA Storm Events lists 1,502 tornado records in Texas for 2015 through 2025, the most of any state, including 234 in the 26 Panhandle counties. A tornado that crosses a county line is recorded once per county, so these are county segments rather than unique tornadoes.
Can I use this data in a story?
Yes. The tables and charts are free to use with credit and a link to CRS Roofing & Construction at https://crsroofer.com/texas-panhandle-wind-damage-study.
Media kit: download graphics
Maps, charts and square stat cards sized for TV (1920x1080) and social (1080x1080), in PNG and SVG. Free to use with credit to CRS Roofing & Construction.